Download
1 / 1
10 likes | 119 Views
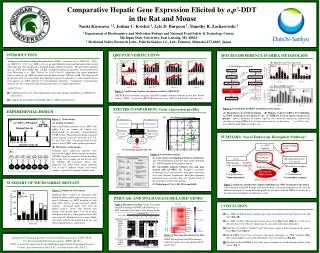
Microarray. PCR. PXR/CAR- AND DNA DAMAGE-RELATED GENES. Table 1 . Microarray results. Genes associated with DNA damage or PXR/CAR following o,p’- DDT treatment in the mouse liver are presented. Figure 5. Heat map for microarray data

E N D
Microarray PCR PXR/CAR- AND DNA DAMAGE-RELATED GENES Table 1. Microarray results. Genes associated with DNA damage or PXR/CAR following o,p’-DDT treatment in the mouse liver are presented. Figure 5. Heat map for microarray data PXR/CAR-regulated and DNA damage-responsive genes were up-regulated in the mouse liver. Highlighted: p1(t)>0.999 1.8 50 2.5 * Cyp2b10 CAR PXR Cyp7b1 * 6 * 40 2.0 * * * 1.2 1.5 30 4 * * * * * 1.0 20 0.6 2 10 0.5 * * * 0 0 0 0 1.8 * 16 Srebf1 Gadd45b Gclm Hmox1 3 1.2 * * 12 * 1.2 2 0.8 8 * 0.6 0.4 1 4 * 0 0 0 0 18 18 18 18 24 24 24 24 2 2 2 2 4 4 4 4 8 8 8 8 12 12 12 12 72 72 72 72 Time (h) Time (h) Time (h) Time (h) Comparative Hepatic Gene Expression Elicited by o,p’-DDT in the Rat and Mouse Naoki Kiyosawa 1,2, Joshua C. Kwekel 1, Lyle D. Burgoon 1, Timothy R. Zacharewski 1 1 Department of Biochemistry and Molecular Biology and National Food Safety & Toxicology Center, Michigan State University, East Lansing, MI, 48824 2 Medicinal Safety Research Labs., Daiichi-Sankyo Co., Ltd., Fukuroi, Shizuoka 437-0065, Japan INTRODUCTION QRT-PCR VERIFICATION SPECIES DIFFERENCE IN DHEA METABOLISM Technical grade dichlorodiphenyltrichloroethane (DDT), a mixture of p,p’-DDT (65 – 80%), o,p’-DDT (15 – 21%), p,p’-TDE (~ 4%), is an agricultural pesticide and malarial vector control agent that has been designated a potential human hepatocarcinogen. We previously reported that o,p’-DDT elicits PXR/CAR-, not ER-, mediated response in immature, ovariectomized rat liver (Kiyosawa et al. 2008, Toxicol Sci 101(2):350-63), suggesting that tumor promotion effects caused by o,p’-DDT in rodents may be derived from CAR but not ER. The objective of the present study is to investigate the molecular response in immature, ovaeriectomized mouse liver against o,p’-DDT exposure by toxicogenomic technique. Comparative toxicogenomic analysis was also conducted using rat microarray data sets reported previously. (B) Hepatic Cyp17a1 expression (A) Steroidogenic pathway Microarray PCR Relative expression (fold) (C) Blood DHEA-S level • OBJECTIVES: • Comprehensively assess the temporal gene expression changes elicited by o,p’-DDT in the mouse liver • Compare the gene expression profile with o,p’-DDT-treated rat liver Rat Mouse * 0.16 Vehicle 0.16 Figure 3. Verification of mouse microarray results by QRT-PCR QRT-PCR was performed using the same RNA samples obtained from the mouse liver treated with o,p’-DDT. * p<0.05 for QRT-PCR data by two-way ANOVA with Tukey’s post hoc test. o,p’-DDT 0.12 0.12 Blood DHEA-S level (nmol/L) 0.08 0.08 0.04 0.04 0 0 2 4 8 12 18 24 72 2 4 8 12 18 24 72 Time (h) Time (h) SPECIES-COMPARISON: Gene expression profiles Figure 6. Perturbation of DHEA metabolism in the mouse (A) Biosynthesis of steroid horomone. (B) Hepatic Cyp17a1 mRNA level following o,p’-DDT treatment in the mouse or rat. (C) DHEA-S levels in mouse serum or rat plasma. Species difference in hepatic Cyp17a1 was observed, which may related with elevation in serum DHEA-S level observed exclusively in the mouse. * p<0.05 by two-way ANOVA with Tukey’s post hoc test. EXPERIMENTAL DESIGN (A) (B) INTRODUCTION AND OBJECTIVES Figure 1. Study design (A) Animal treatment Oneor three daily oral doses of o,p’-DDT (300 mg/kg b.w.) or sesame oil vehicle was administered to immature, ovariectomized C57BL/6 mice. Each treatment group consisted of five animals. Liverwas harvested at 2, 4, 8, 12, 18, 24 or 72 hrs. The dosage level was the same as our rat DDT study reported previously. (B) Microarray study design Temporal gene expression patterns were analyzed by Agilent whole genome microarray (4X44K) using the reference design including dye-swaps. Three samples per group were used for labeling and examined. Arrow tails represent Cy3 while arrow heads represent Cy5. V and T indicate vehicle and treated samples, respectively; numbers indicate time. (A) o,p’-DDT (300 mg/kg) Dosing Time (h) 0 24 48 SUMMARY: Novel Endocrine Disruption Pathway? 2 4 8 12 18 24 72 Sacrifice Time (h) Cyp17a1 (B) (C) Figure 4. Correlation analysis (A) Active genes overlapping in both rat and mouse. The 106 homologous genes that were active following o,p’-DDT treatment in both mouse and rat. (B) Correlation analysis between rats and mice treated with o,p’-DDT. The Pearson’s correlation coefficients were calculated for both gene expression level and statistical significance. Each plot represents individual genes, and the plots are colored based on the similarity of expression patterns. (C)Definition of CAS, CAD, DAS and DAD). SUMMARY OF MICROARRAY RESULTS Figure 7. Summary of molecular response following o,p’-DDT treatment in the mouse. CAR activation and DNA damage may be risk factors for tumor promotion in the liver. In addition, alteration of steroid hormone profile by elevation of blood DHEA level may be a risk factor for perturbation of endocrine system. Figure 2. Number of active genes Empirical Bayes analysis of microarray data identified differentially expressed genes (active genes) following o,p’-DDT treatment at each time point relative to time matched vehicle controls. Annotated genes were used for further analysis. Genes with absolute fold change value greater than 1.5 at one or more time points and p1(t) value greater than 0.999 were selected. Number of active genes. Black and white indicate the proportion of up- and down-regulated genes, respectively. CONCLUSION • o,p’-DDT elicited relatively similar gene expression profile in the liver between rats and mice (Fig. 4B) • o,p’-DDT elicited CAR activation in the mouse liver (Fig. 5 and Table 1) as well as rat (Toxicol Sci 101(2):350-63), which may be associated with tumor promotion • Induction of Gadd45a, Gadd45b and Cdkn1 genes suggests DNA damage in the mouse liver (Fig. 5 and Table 7) • Blood DHEA-S level was elevated in the mouse following o,p’-DDT treatment (Fig. 6C), which might be associated with hepatic Cyp17a1 induction (Fig. 6B) • Elevation in blood DHEA-S level may cause alteration of steroid hormone profile in the mouse (Fig. 7) Supported by National Institute of General Medical Sciences (GM075838); U.S. Environmental Protection Agency (RD83184701). T.R.Z. is partially supported by the Michigan Agricultural Experiment Station. Contact: kiyosawa@msu.edu (N.K.), tzachare@msu.edu (T.R.Z.)


![[V]. Process of Transcription and Transcriptional Control of Gene Expression](https://cdn2.slideserve.com/5058527/v-process-of-transcription-and-transcriptional-control-of-gene-expression-dt.jpg)