Regression, correlation and liquid association in complex genomic data analysis
1.22k likes | 1.46k Views
Regression, correlation and liquid association in complex genomic data analysis. Ker-Chau Li Institute of Statistical Science, Academia Sinica. cond1 cond2 …….. condp. gene-expression data. gene1gene2 gene n. x11 x12 …….. x1p x21 x22 …….. x2p

Regression, correlation and liquid association in complex genomic data analysis
E N D
Presentation Transcript
Regression, correlation and liquid association in complex genomic data analysis Ker-Chau Li Institute of Statistical Science, Academia Sinica
cond1 cond2 …….. condp gene-expression data gene1gene2 gene n x11 x12 …….. x1p x21 x22 …….. x2p … …
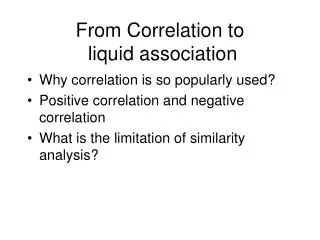
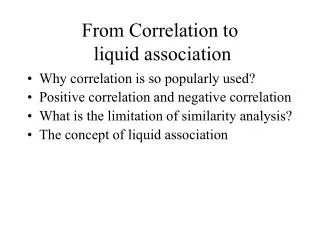
Historical review of correlation • Why using mean ? • Why using standardization? • Outliers • Rank correlation • Normal score transformation
Theory of liquid association • Definition of LA • Stein lemma • Compute LA • Normal score transformation • P-value • LA plot
Generalization of liquid association • Binary Z • Transforming X and Y • A paradigm of using liquid association • LAP web application http://kiefer.stat2.sinica.edu.tw/LAP3 (Note: case sensitive)
Regression: model, correlation and prediction Regression toward the mean http://en.wikipedia.org/wiki/Regression_toward_the_mean#History
Regression, correlation • Sir Francis Galton (1822-1911), • half-cousin of Charles Darwin, • was an EnglishVictorian polymath, anthropologist, eugenicist, tropical explorer, geographer, inventor, meteorologist, proto-geneticist, psychometrician, and statistician. He was knighted in 1909. • Galton invented the use of the regression line (Bulmer 2003, p. 184), and was the first to describe and explain the common phenomenon of regression toward the mean, which he first observed in his experiments on the size of the seeds of successive generations of sweet peas. Bivariate normal
Pearson correlation • Corr (X,Y) = E[(X-E(X))(Y-E(Y) ]/ SD(X)SD(Y) X,Y are two random variables Corr (often denoted , or r ) is between -1 and 1 r= 0 , uncorrelated >0, positive correlation <0, negative correlation Intuitive illustration: larger value of X correlates with Larger value of Y (r>0) Larger value of X correlates with smaller value of Y (r<0) Choice of average value : E(X), E(Y) { why not using median ??? Galton did so} Application in microarray gene expression analysis
Elliptically contoured bivariate distribution • The set of points with equal frequencies of occurrence lie on concentric ellipses with common center, shape and orientation Under the additional assumption that the marginal distributions of X and Y are normal and the , it can be proved that the joint distribution of X,Y must follow a bivariate normal distribution, joint density function : f(x,y)= a little bit complex Parameters of mean of X, mean of Y, SD of X, SD of Y, correlation, 1, 2,1,2,
prediction • SD of height (assume = 1 inch, remains same from generation to generation) • Father 1 inch above (below) mean • Son r inches above (below) mean • Grandson r2 inches above (below) mean • Grand grandson r3 inches above(below) mean • N generation later rN inches above(below) mean • which tends to 0 [T]he mean filial regression toward mediocrity was directly proportional to the parental deviation from it. - Galton Recall : median is used in his definition of SD
Required conditions for regression effect • If E(Y|X) is linear in X, then E(Y|X) = a+ b X b= given before If SD(X)=SD(Y), then b= r which is between 0 and 1 for positive correlated case. So regression effect is direct consequence of mathematics ( I am sure if this is statistical or not!) • Correlation or regression are not equivalent to causal relationship • Regression can be forward or inverse
Error of prediction • Y= a + bX + error b= r SD(Y)/SD(X) R-squared = var (fit)/var (Y)= Var(a +bX)/Var(Y) = Var(bX)/Var(Y)=b2var(X)/Var(Y)= r2 [SD(Y)2/SD(X)2 ]var(X)/var(Y) = r2 F-ratio = [var(fit)/d.f of fit ]/ [var(error)/ d.f. of residual] d.f. of fit = number of regression parameters (excluding intercept) (= dimension of regressor in multiple linear regression), d.f. of residual = number of cases - 1-d.f. of fit
Inverse regression line • Assume r=0.6 • The expected height of the son of a father 1 inch taller than average is 0.6 inches taller than average • What is the expected height of the father of a son whose height is 0.6 taller than average ? 1 inches taller than average ?
Sliced inverse regressionfor dimension reduction • Inverse point of view of regression is useful in reducing the dimensionality of regressors • Instead of considering E(Y|x1, ..xp) which is a p-dimensional surface, it is simper to consider E(x1|Y), E(x2|Y) …E(xp|Y) which is a one-dimensional curve in p-dimensional space.
Binary input and binary output • Event A correlates with Event B (p53 mutation correlates with decreased survival; Aberrant p53 expression correlates with expression of vascular endothelial growth factor mRNA and interleukin-8 mRNA and neoangiogenesis in non-small-cell lung cancer (Yuan et al, 2002, J.Clin.Oncol.20, 900-910) Mathematically, does it imply Event B correlates Event A ? Can you prove it or disprove it ? (Homework ) Many ways of measuring correlation have been proposed such as rank correlation, Fisher-Yates correlation, etc.
Why clustering make sense biologically? The rationale is Genes with high degree ofexpression similarityare likely to befunctionally related. may form structural complex, may participate incommon pathways. may be co-regulated bycommon upstreamregulatory elements. Simply put, Profile similarity implies functional association
However, the converse is not true • Microarray is too noisy • Biology is complex The expression profiles of majority of functionally associated genes are indeed uncorrelated
Patterns of Coexpression for Protein Complexes by Size in Saccharomyces CerevisiaeNAR 2008,Ching-Ti Liu, Shinsheng Yuan, Ker-Chau Li • Many successful functional studies by gene expression profiling in the literature have led to the perception that profile similarity is likely to imply functional association. But how true is the converse of the above statement? Do functionally associated genes tend to be co-regulated at the transcription level? In this paper, we focused on a set of well-validated yeast protein complexes provided by Munich Information Center for Protein Sequences (MIPS). Using four well-known large-scale microarray expression datasets, we computed the correlations between genes from the same complex. We then analyzed the relationship between the distribution of correlations and the complex size (the number of genes in a protein complex). We found that except for a few large protein complexes such as mitochondrial ribosomal and cytoplasmic ribosomal proteins, the correlations are on the average not much higher than that from a pair of randomly selected genes. The global impact of large complexes on the expression of other genes in the genome is also studied. Our result also showed that the expression of over 85% of the genes are affected by six large complexes: the cytoplasmic ribosomal complex, mitochondrial ribosomal complex, proteasome complex, F0/F1 ATP synthase (complex V) (size 18), rRNA splicing (size 24), and H+- transporting ATPase, vacular (size 15).
Yeast Cell Cycle(adapted from Molecular Cell Biology, Darnell et al)
cond1 cond2 …….. condp gene-expression data gene1gene2 gene n x11 x12 …….. x1p x21 x22 …….. x2p … … Four large scale datasets
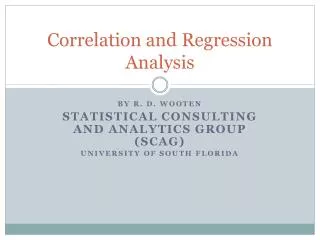
Figure 1. Comparison of correlation distributions for protein pairs with respect to functional association (shown in left panel) and complex size (shown in right panel). The terms “cc”, “yg”, “rst” and “st1” represent four different data sets: cellcycle, segregation genetics, rosetta and stress data, respectively. Protein complex pairs are abbreviated as “rel” and unrelated pairs are abbreviated as “unrel”.
Why no correlation? • Protein rarely works alone • Protein has multiple functions • Different biological processes or pathways have to be synchronized • Competing use of finite resources : metabolites, hormones, • Protein modification: Phosphorylation, proteolysis, shuttle, … Transcription factors serving both as activators and repressors
The thyroid hormone receptordiffers functionally from glucocorticoid receptor in two important respects : it binds to its DNA response elements in theabsenceof hormone, and the bound protein represses transcription rather than activating it. Whenthyroidhormone binds to the thyroid hormone receptor, the receptoris converted from a repressor to an activator. Gene A = gene producesTHR Gene B= gene regulated byTHR THR alone represses B THR+ HM activates B
Transcription factors: proteins that bind to DNAActivator; repressors
Expression levels of A and B can be either positively correlated or negatively correlated, depending on thyroid hormone level. If during an experiment, hormone level fluctuated as organisms try to accomplish different tasks and if we cannot tell what tasks are, then ..... Of course, the book is not talking about yeast there. However, Pairwise similarity is not enough! THR alone represses B THR+ HM activates B
Liquid Association (LA) • LA is a generalized notion of association for describing certain kind of ternary relationship between variables in a system. (Li 2002 PNAS) • Green points represent four conditions for cellular state 1. • Red points represent four conditions for cellular state 2. • Blue points represent the transit state between cellular states 1 and 2. • (X,Y) forms a LA. Profiles of genes X and Y are displayed in the above scatter plot. Important! Correlation between X and Y is 0
Statistical theory for LA • X, Y, Z random variables with mean 0 and variance 1 • Corr(X,Y)=E(XY)=E(E(XY|Z))=Eg(Z) • g(z) an ideal summary of association pattern between X and Y when Z =z • g’(z)=derivative of g(z) • Definition. The LA of X and Y with respect to Z is LA(X,Y|Z)= Eg’(Z)
Statistical theory-LA • Theorem. If Z is standard normal, then LA(X,Y|Z)=E(XYZ) • Proof. By Stein’s Lemma : Eg’(Z)=Eg(Z)Z • =E(E(XY|Z)Z)=E(XYZ) • Additional math. properties: • bounded by third moment • =0, if jointly normal • transformation
Stein Lemma • To compute E(g’(Z)) is not easy. With help from mathematical statistics theory, the LA(X,Y|Z) can be simplified as E(XYZ) when Z follows normal distribution. Stein lemma
Normality ? • Convert each gene expression profile by taking normal score transformation • LA(X,Y|Z) = average of triplet product of three gene profiles: (x1y1z1 + x2y2z2 + …. ) / n
Liquid Association is notPartial correlation • X, Y, Z • Z->Y, Z->X (Causal analysis ) • X=aZ+b+error • Y=a’Z+b’+error’ Partial correlation =corr (error, error’) If Z causes X and Y, then partial correlation=0 (X=Coke sale, Y=eye disease incidence rate, Z=season) Start with a pair of correlated genes X, Y, find Z to minimize partial correlation. This is very different from LA. Graph representation
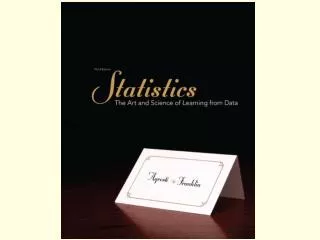
Figure 4. Urea cycle/argininbiosynthesis pathway. ARG2 encodes acetyl-glutamate synthase, which catalyzes the first step in synthesizing ornithine from glutamate. Ornithine and carbamoyl phosphate are the substrates of the enzyme ornithine transcarbamoylase, encoded by ARG3. Carbamoyl phosphate synthetase is encoded by CPA1 and CPA2. ARG1 encodes argininosuccinate synthetase, ARG4 encodes argininosuccinase, CAR1 encodes arginase, and CAR2 encodes ornithine aminotransferase. ARG1 8th place negative Y Head X Compute LA(X,Y|Z) for all Z Backdoor Rank and find leading genes Adapted from KEGG
Why negative LA?high CPA2 : signal for arginine demand. up-regulation of ARG2 concomitant with down-regulation of CAR2 prevents ornithine from leaving the urea cycle.When the demand is relieved, CPA2 is lowered, CAR2 is up-regulated, opening up the channel for orinthine to leave the urea cycle.
Statistical significance • P-value can be calculated by permutation test or by large sample approximation • Plot of liquid association is provided by two methods: MLE for mixture model discrete method
How does LA work in cell-lines? Alzheimer’s Disease hallmark gene Amyloid-beta precursor protein (APP)
Liquid association: A method for exploiting lack of correlation between variables
Alzheimer’s disease The brain tissue shows "neurofibrillary tangles" (twisted fragments of protein within nerve cells that clog up the cell), "neuritic plaques" (abnormal clusters of dead and dying nerve cells, other brain cells, and protein), and "senile plaques" (areas where products of dying nerve cells have accumulated around protein). Although these changes occur to some extent in all brains with age, there are many more of them in the brains of people with AD. The destruction of nerve cells (neurons) leads to a decrease in neurotransmitters (substances secreted by a neuron to send a message to another neuron). The correct balance of neurotransmitters is critical to the brain.
Amyloid beta peptide is the predominant component of senile plagues in brains of MD patients. It is derived from Amyloid-beta precusor protein (APP) by consecutive proteolytic cleavage of Beta-secretaseand gamma-secretase
What is the physiological role of APP? Cao X, Sudhof TC. A transcriptionally active complex of APP with Fe65 and histone acetyltransferase Tip60. Science. 2001 Jul 6;293(5527):115-20.
Abstract of Cao and Sudhof Amyloid-beta precursor protein (APP), a widely expressed cell-surface protein, is cleaved in the transmembrane region by gamma-secretase. gamma-Cleavage of APP produces the extracellular amyloid beta-peptide of Alzheimer's disease and releases an intracellular tail fragment of unknown physiological function. We now demonstrate that thecytoplasmic tail of APP forms a multimeric complex with the nuclear adaptor protein Fe65 and the histone acetyltransferase Tip60. This complex potently stimulates transcription via heterologous Gal4- or LexA-DNA binding domains, suggesting that release of the cytoplasmic tail of APP by gamma-cleavage may function ingene expression.
Take X=APP, Y=APBP1 • APBP1 encodes FE65 • Find BACE2 from our short list of LA score leaders. • BACE2 encodes a beta-site APP-cleaving enzyme
Take X=APP, Y=HTATIPHTATIP encodes Tip60 Finds PSEN1 (second place positive LA score leader) Which encodes presenilin 1, a major component of gamma-secretase