Download

1 / 20
200 likes | 538 Views
Regeneration, Repair, and Plasticity. Chapters 6, 7, 8, 10 P.S. Timiras. Brain Plasticity and CNS Regenerative Potential. From the beginning of the 20th Century until the 1990s, it was stated that neurons DID NOT proliferate.

E N D
Regeneration, Repair, and Plasticity Chapters 6, 7, 8, 10 P.S. Timiras
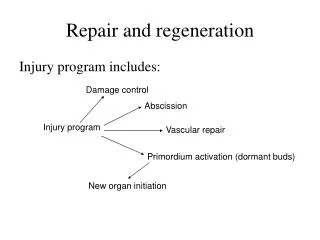
Brain Plasticity and CNS Regenerative Potential • From the beginning of the 20th Century until the 1990s, it was stated that neurons DID NOT proliferate. • The fact that they COULD NOT proliferate did not exclude the possibility of proliferation under “specific conditions.” • In fact, the CNS has a considerable regenerative potential depending on the special conditions of the neuronal environment.
Neurons that may proliferate into adulthood include: • Progenitor “precursor” neurons lining the cerebral ventricules • Neurons in the hippocampus • Neurons usually “dormant” with potential for neuron and glia proliferation • Neuroglia (astrocytes, oligodentrocytes) and microglia (immune cells) with the ability to perpetually self renew and produce the three types of neural cells
Regenerative potential depends on changes in whole body and neural microenvironment • Whole body changes: • Physical exercise • Appropriate nutrition • Good circulation • Education • Stress • others • Neural microenvironment • changes: • Brain metabolism (oxygen consumption, free radicals, circulatory changes) • Hormonal changes (estrogens, growth factors, others) • others
Death Rates in 1986 among Persons 25- 64 Years Old in Selected Education and Income Groups According to Race and Sex. ________________________________________________________ GroupWhite Black Men Women Men Women deaths per 1000 Education- yr Completed School 0-11 7.6 3.4 13.4 6.2 12 4.3 2.5 8.0 3.9 College 1-3 4.3 2.1 5.0 3.2 4 2.8 1.8 6.0 2.2 Income-$ <9,000 16.0 6.5 19.5 7.6 9,000-14,999 10.2 3.4 10.8 4.5 15,000-18,999 5.7 3.3 9.8 3.7 19,000-24,999 4.6 3.0 4.7 2.8 >25,000 2.4 1.6 3.6 2.3 ______________________________________________________________________________________ Pappas, G., Queen, S., Hadden, W., and Fisher, G. The increasing disparity in mortality between socioeconomic groups in the United States, 1960 and 1986. N. Engl. J Med. 329, 103-109, 1993.
Proportion of Remaining Life Expected to be Lived with a Disability in Activities of Daily Living and Death Rates ________________________________________________________ At Age At Age At Age Death Rates 65 75 85 per 1,000 White men Low education .11 .21 .45 7.6 Higher education .10 .19 .37 2.8 White women Low education .15 .24 .45 3.4 Higher education .14 .23 .40 1.8 Black men Low education .13 .22 .36 13.4 Higher education .11 .18 .31 6.0 Black women Low education .15 .22 .36 6.2 Higher education .14 .21 .31 2.2 ________________________________________________________________________ From: Guralink, J.M., et al., Educational status and active life expectancy among older blacks and whites, N Engl. J Med., July 8, 1993, Vol. 29:110-116
Better access to medical care Better access to recreational activity Better nutrition Higher income Responsibility to health behaviors No alcohol intake Increased brain reserve capacity? More dendritic branching, cortical synapses?; Better cerebral blood flow?; Better neural cell efficiency, adaptability, redundancy, survival and growth Mechanisms of Education Effects No smoking
Fig. 7-4: “Denudation” of the neurons. Changes in pyramidal neurons of the aging human cerebral cortex
Anatomical Correlates of Educational Protective Effects* Educational Level Increasing levels from <12 to >12 grades Anatomical Correlate total dendritic length mean dendritic length dendritic segment count Location Pyramidal cells in layer 2,3 of Wernicke’s area Variable Studied Gender Hemisphere Education Personal history Hormonal Correlate Thyroid Hormones dendritic number and length Glucocorticoids reactive synaptogenesis ______________ * From Jacobs et al., J Comp. Nuerol., 327, 97, 1993
Perceived Functioning of Medicare Beneficiaries, by Gender and Age, 2002 100 Perform with difficulty 65-74 years 75-84 years 85 years and over 80 60 40 20 0 Women Men Women Men Women Men Mobility Limitation ADL IADL Source: Health & Health Care of the Medicare Population: Data from the 2002 Medicare Current Beneficiary Survey. Rockville, MD: Westat, February 2006
Evidence from several laboratories show: That in the brain there are neural cells which can divide These are cells located in: olfactory bulbs hippocampus ependymal cells (in proximity of the ventricles) glial cells (astrocytes which can de-differentiate & differentiate into neurons) From Wong, R.J., Thung, E., et al., Keeping Cells Young: The role of growth factors in restricting cell differentiation in cultured neuroglia, FASEB Journal, 17(5): A967, 2003.
Neural Cells • Common ectodermic derivation of neurons and neuroglia • Astrocytes: • Star shaped cells • Support neurons metabolically • Assist in neuronal transmission • Oligodendrocytes: myelinate neurons Neural Epithelium Neuroblast Spongioblast Neuron Migratory Spongioblast Astrocyte Ependyma Oligodendrocyte Astrocyte
Growth Curves Measuring Neuroglial Cell Proliferation FGF EGF * Proliferation increased most effectively with the 50 ng/ml dose (193% over control cells) for EGF, reaching a peak at day 10 * Proliferation increased most effectively with the 80 ng/ml dose (269% over control cells) for FGF, reaching a peak at day 8
Assays of enzymatic activity (e.g. glutamine synthetase--a marker of astrocytes) show decreased activity suggesting a loss of astrocytic specificity • From: • Proliferation • Maturation • To: • Proliferation • De-differentiation
“Activated” astrocyte Proliferating astrocytes Astrocyte Neuroblast migrate From: Doetsch, F., et al., Neuron, 36:1021, 2002.
Tsonis, P.A., Stem Cells from Differentiated Cells, Mol. Interven.,4, 81-83, 2004 • From newt amputated limb, terminally differentiated cells de-differentiate by losing their original characteristics. This de-differentiation produces blastema cells that then re-differentiate to reconstitute the lost limb. • After lentectomy de-differentiated cells lose pigment and regenerate a perfect lens. • De-differentiated myotubes produce mesenchymal progenitor cells that are able to differentiate in adipocytes and osteoblasts. Also refer to: Brawley, C. and Matunis, E., Regeneration of male germ line stem cells by spermatogonial de-differentiation in vivo. Science 304, 1331-1334. 2004
The brain regulates motor function and, reciprocally, Motor function influences brain activity Throughout life, One’s behavior can change the structure of the brain And these changes Can affect how we behave in our environment Get Up and Move: A Call to Action for Older Men & Women
Additional Studies • To promote regeneration/repair responses in aging muscle: • Injection of growth hormone in aging cardiac muscle • Implantation of stem cells into infarcted cardiac muscle