Download

1 / 28
350 likes | 692 Views
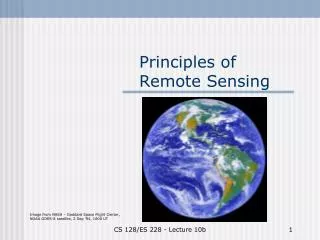
Principles of Remote Sensing. Image from NASA – Goddard Space Flight Center, NOAA GOES-8 satellite, 2 Sep ’94, 1800 UT. Scanning planet Earth from space. History of remote sensing. Earliest vehicle was …? Tournachon (‘Nadar’) took 1 st aerial photograph in 1858 (since lost)

E N D
Principles of Remote Sensing Image from NASA – Goddard Space Flight Center, NOAA GOES-8 satellite, 2 Sep ’94, 1800 UT CS 128/ES 228 - Lecture 9a
Scanning planet Earth from space CS 128/ES 228 - Lecture 9a
History of remote sensing • Earliest vehicle was …? • Tournachon (‘Nadar’) took 1st aerial photograph in 1858 (since lost) • Earliest conserved aerial photograph: Boston, J. Black, 1860 • Early applications were in military reconnaissance CS 128/ES 228 - Lecture 9a
WWII – heavy use of aerial reconnaissance Images: Avery. 1977. Interpretation of Aerial Photographs. 3rd ed. Burgess Press, Minneapolis, MN. CS 128/ES 228 - Lecture 9a
“Spy planes” & the Cold War CS 128/ES 228 - Lecture 9a
Satellite sensing • Russian Sputnik (1957)- radio transmitter only • Rapid response by US:CORONA (1960) • Early applications: military reconnaissance CS 128/ES 228 - Lecture 9a
Advantages of satellites • Wide coverage • Vertical (orthogonal) view • Multi-spectral data bands • Rapid data collection CS 128/ES 228 - Lecture 9a
Sources of EM radiation Key distinction: • passive sensing • active sensing Spectral ‘signatures” Top: Lo & Yeung, fig. 8.1 Bottom: ASTER Spectral Library (http://speclib.jpl.nasa.gov) CS 128/ES 228 - Lecture 9a
Types of EM radiation used Three important spectral bands: • visible light • infrared radiation • microwave radiation Image from NASA 1987. SAR: Synthetic Aperture Radar. Earth Observing System, Vol. IIf. CS 128/ES 228 - Lecture 9a
Atmospheric attenuation Scattering • caused by aerosols (water vapor, dust, smoke) • more intense at shorter wavelengths • why the sky is blue • Absorption • caused by gas molecules (H2O, CO2, O2, O3) • each molecule absorbs at a specific wave-length • result: atmospheric transmission windows CS 128/ES 228 - Lecture 9a
Transmission windows • UV-visible-IR • Microwave Image from NASA 1987. From Pattern to Process: The Strategy of the Earth Observing System. Vol. II. CS 128/ES 228 - Lecture 9a
Classes of sensors Photographic • panchromatic • color • Multi-spectral scanners • sensors for many wavelengths • image scanned across sensors • Infrared (IR) • film (near IR) • thermal IR sensors for longer wave-lengths • Radar • RAdio Detection And Ranging • active imaging CS 128/ES 228 - Lecture 9a
Visual sensors: film types • panchromatic • near-infrared • color Both images from Committee on Earth Observation Satellites http://ceos.cnes.fr:8100/cdrom-98/ceos1/irsd/content.htm CS 128/ES 228 - Lecture 9a
Infrared sensors • IR penetrates haze and light cloud cover • can be used at night • used by military for camouflage detection • IR ‘signature’ often distinct from visible image CS 128/ES 228 - Lecture 9a
Color IR film • Used with yellow (blue-absorbing) filter • 3 primary pigments, but not “true” (visible) color - green vegetation = red- clear water = dark blue- turbid water = bright blue- soil = green- urban areas = pale blue Top image: Committee on Earth Observation Satellites http://ceos.cnes.fr:8100/cdrom-98/ceos1/irsd/content.htm Bottom image: Avery. 1977. Interpretation of Aerial Photographs. 3rd ed. Burgess Press, Minneapolis, MN. CS 128/ES 228 - Lecture 9a
Multispectral sensors • Visible + IR spectra • Comparison of film and electronic sensor spectral bands Top: Avery 1977. Interpretation of Aerial Photography. Burgess Publ., Ninneapolis Bottom: ASTER Science page (http://www.science.aster.ersdac.or.jp/users/parte1/02-5.htm#3) CS 128/ES 228 - Lecture 9a
Radar sensors • active sensing • day & night, all weather • less affected by scattering (aerosols) • vertical or oblique perspective Lo & Yeung, fig. 8.13 CS 128/ES 228 - Lecture 9a
Uses of radar: altimetry • satellite-nadir distance • geoid & topographic measurements • sea elevation, tides & currents • wave/storm measurements Both images from NASA 1987. Altimetric System. Earth Observing System, Vol. IIh. CS 128/ES 228 - Lecture 9a
Uses of radar: SAR • glaciology • hydrology • vegetation science • geology Image from NASA 1987. SAR: Synthetic Aperture Radar. Earth Observing System, Vol. IIf. CS 128/ES 228 - Lecture 9a
Sensor resolution • Spatial: size of smallest objects visible on ground. Ranges from < 1m to > 1 km. Inversely related to area covered by image • Spectral: wavelengths recorded. Ex. panchromatic film (~0.2 – 0.7 µm); Landsat Thematic Mapper bands (0.06 to 0.24 µm wide) • Radiometric: # bits/pixel. Ex. Landsat TM (8 bit); AVRIS (12 bit) • Temporal: for satellite, time to repeat coverage. Ex. Landsats 5 & 7 (16 days) CS 128/ES 228 - Lecture 9a
Spatial resolution: analog (film) images Depends on: • lens quality & camera stability • size of negative • film grain High quality aerial photograph: • up to 60 lines/mm • 9 x 9” (23 x 23 cm) negative • scanned at 3000 dpi = ~725 megapixels • if 8 bit image depth, >5 GB image size CS 128/ES 228 - Lecture 9a
Ground resolution G. R. = scale factor / film resolution CS 128/ES 228 - Lecture 9a
Spatial resolution: digital (satellite) images A sampler of recent (civilian) satellites: CS 128/ES 228 - Lecture 9a
Satellite image resolution Quickbird 2 • Commercial venture • 0.63 m resolution • U.S. trying to discourage open access to finer resolution images Digitalglobe.com CS 128/ES 228 - Lecture 9a
Satellite orbits Geostationary • 36,000 km above equator Polar • varying heights • often in Sun-synchronous orbits Both diagrams from European Organisation for the Exploitation of Meteorological Satellites www.eumetsat.de/en/mtp/space/polar.html CS 128/ES 228 - Lecture 9a
Satellite coverage Geostationary • no polar coverage • coverage is 24/7 • low ground reso-lution (~ 1 km) Polar • global coverage • coverage is dis-continuous Both diagrams from European Organisation for the Exploitation of Meteorological Satellites www.eumetsat.de/en/mtp/space/polar.html CS 128/ES 228 - Lecture 9a
Geostationary orbits Ex. GOES satellites • Meteorological satellites • GOES-8 at 75oW, GOES-9 at 135oW • 5 bands (1 visible, 4 thermal infrared) Image from NASA – Goddard Space Flight Center, NOAA GOES satellite, Hurricane Floyd, 15 Sep ‘99 CS 128/ES 228 - Lecture 9a
Polar orbits Ex. Landsat & Terra satellites • 705 km height, ~100 minute orbit • 185 km swath • 16 day repeat • Sun-synchronousorbits (~0945 a.m. equator crossing) Orbit tracking data from NASA – http://liftoff.msfc.nasa.gov/realtime/JTrack/eos.html, 5 Mar ‘03 CS 128/ES 228 - Lecture 9a