Download
1 / 29
290 likes | 404 Views
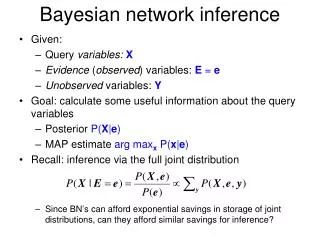
This paper discusses network inference, a method to deduce an underlying network of interactions from indirect observational data. We explore applications such as inferring protein-protein interactions (PPIs) and gene associations linked to stem cell functionality. Using GMT files, we summarize network structures and utilize algorithms to sample networks consistent with given data. The study demonstrates validation through comparison with established databases and offers insights into combining different perspectives from high-throughput experiments. Our approach lays the framework for further explorations in adverse event reporting and statistical interaction networks.

E N D
Network inference from repeated observations of node sets Neil Clark, AviMa'ayan
Network Inference Protein-Protein interaction network Cell signaling network
Overview • Network inference - the deduction of an underlying network of interactions from indirect data. • A general class of network inference problem • Network inference approach • Application: • inference of physical interactions: PPI • Inference of gene associations: Stem cell genes • inference of statistical interactions: Drug/side effect network
The inference problem • Input: a set of entities (genes or proteins or ...) in the form of a GMT file - the results of experiments, or sampling more generally. • Assumptions: • 1 An underlying network exists which relates the interactions between the entities in the GMT file • 2 Each line of the GMT file contains information on the connectivity of the underlying network • The problem: Given a GMT file can we extract enough information to resolve the underlying network?
Approach... • Forget for the moment that we know the underlying network and pretend we only have the GMT file. • Attempt to use the accumulation of our course data to infer the fine details of the underlying network. • Consider the set of all networks that are consistent with our data - there are likely to be many. • Use an algorithm to sample this ensemble of networks randomly. • The mean adjacency matrix gives the probability of each link being present within the ensemble.
Analytic Approximation • When applying this approach to real data typically there are large numbers of nodes • Sample space of networks can be very large -> computationally demanding • Write a simple analytical approximation which mimics the action of the algorithm.
Correction for sampling bias • Destroy any information by a random permutation of the GMT file and compare the actual edge weight to the distribution of edge weights from the randomly permuted GMT files:
Application to Infer PPIs MalovannayaA et al. Analysis of the human endogenous coregulatorcomplexome. Cell. 2011 May 27;145(5):787-99
Validataion • Compare inferred PPI network to the following databases: • BioCarta • HPRD PPIInnateDB • IntAct • KEGG • MINT mammalia • MIPS • BioGrid
Application to stem cells • We used two types of high-throughput data from the ESCAPE database (www.maayanlab.net/ESCAPE). • Chip X data: from Chip-Chip and Chip-seqexperiments. • 203,190 protein DNA binding interactions in the proximity of coding regions from 48 ESC-relevant source proteins. • Logof followed by microarray data: A manually compiled database of Protein-mRNA regulatory interactions deriving from loss-of-function gain-of-function followed by microarray profiling. • 154,170 interactions from 16 ESC-relevant regulatory proteins from loss-of-function studies, and 54 from gain-of-function studies.
Combining networks • Each data source gives a different perspective on the associations between the genes • New insights may possibly be gained by combining the different perspectives. e.g. small but consistent associations across different perspectives will be revealed by the enhanced signal-to-noise ratio.
Application II: Inference of Network of statistical relationships in AERS database • Adverse Event Reporting System (AERS) database contains records of .... AERS Record 1 Drug 1, Drug 2, ... Side-effect 1, Side-effect 2, ... AERS Record 2 Dug 3, Drug 4, ... Side-effect 3, Side effect 4, ... ……
Summary • We described a general class of problem in network inference. • A network of physical interactions between proteins is inferred based on high-throughput IP/MS experiments • The method has been applied to examine associations between stem-cell genes from multiple perspectives • We have begun to apply the approach to the inference of statistical interactions between drugs and side-effects based on the AERS database • More details can be found on the website www.maayanlab.net/S2N