Gene Regulatory Network Inference
Gene Regulatory Network Inference. Progress in Disease Treatment. Personalized medicine is becoming more prevalent for several kinds of cancer treatment 10-Feb-2009 – Breast Bioclassifier developed at the Huntsman Cancer Institute 1/8 women will be diagnosed with breast cancer

Gene Regulatory Network Inference
E N D
Presentation Transcript
Progress in Disease Treatment • Personalized medicine is becoming more prevalent for several kinds of cancer treatment • 10-Feb-2009 – Breast Bioclassifier developed at the Huntsman Cancer Institute • 1/8 women will be diagnosed with breast cancer • Microarray analysis can separate large group who need no treatment • Savings in cost and lifestyle • With $100 human genomes, doctors can determine which drugs will be effective for your genotype
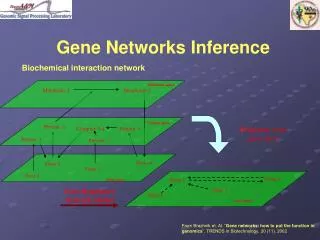
Biological Networks • Gene regulatory network: two genes are connected if the expression of one gene modulates expression of another one by either activation or inhibition • Protein interaction network: proteins that are connected in physical interactions or metabolic and signaling pathways of the cell; • Metabolic network: metabolic products and substrates that participate in one reaction;
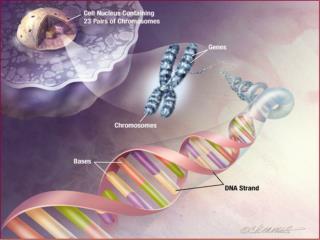
Background Knowledge • Cell reproduction, metabolism, and responses to the environment are all controlled by proteins; • Each gene is responsible for constructing a single protein; • Some genes manufacture proteins which control the rate at which other genes manufacture proteins (either promoting or suppressing); • Hence some genesregulate other genes (via the proteins they create) ;
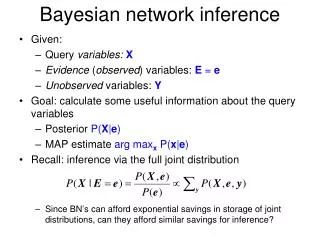
What is Gene Regulatory Network? • Gene regulatory networks (GRNs) are the on-off switches of a cell operating at the gene level. • Two genes are connected if the expression of one gene modulates expression of another one by either activation or inhibition • An example.
Sources: http://www.ornl.gov/sci/techresources/Human_Genome/graphics/slides/images/REGNET.jpg
Why Study GRN? • Genes are not independent; • They regulate each other and act collectively; • This collective behavior can be observed using microarray; • Some genes control the response of the cell to changes in the environment by regulating other genes; • Potential discovery oftriggering mechanism and treatments for disease;
Learning Causal Relationships • High-throughput genetic technologies empowers to study how genes interact with each other; • If gene A consistently turns on after Gene C, then gene C may be causing gene A to turn on • We have to have a lot of carefully controlled time series data to infer this
Kegg • http://www.genome.jp/kegg/pathway.html
Samples Genes Microarray data • Gene up-regulate, down-regulate;
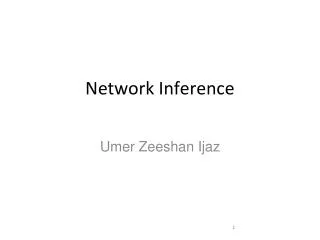
Learning from microarray data • Recurrent Neural Networks • Bayesian learning approaches
AIRnet: Asynchronous Inference of Regulatory networks • Classify gene levels using k-means clustering • Compute influence vectors (i.v.) • Convert i.v.'s into a sorted list of edges • Use Kruskal's algorithm to find the minimum-cost spanning tree
Influence Vectors Perform pairwise-comparisons of change in gene levels between samples, adding or subtracting from i.v. Divide i.v. by the total number of comparisons
Clockwise from top left: • simulated E.coli 1 network; • E.coli 1 inferred correlations above 50%; • simulated E.coli 2 network; • E.coli 2 inferred correlations above 50%; • inferred networks made using 2 bins for each gene.
← Trisomic network Euploid network →
Graph highlighting differences between Euploid and Trisomic using multiple datasets
Using phylogenetic profiles to predict protein function • Basic Idea: Sequence alignment is a good way to infer protein function, when two proteins do the exact same thing in two different organisms. • But can we decide if two proteins function in the same pathway? • Assume that if the two proteins function together they must evolve in a correlated fashion: • every organism that has a homolog of one of the proteins must also have a homolog of the other protein
Phylogenetic Profile • The phylogenetic profile of a protein is a string consisting of 0s and 1s, which represent the absenceor presence of the protein in the corresponding sequenced genome; Protein P1: 0 0 1 0 1 1 0 0 Protein P2: 0 0 1 0 1 1 0 0 Protein P3: 1 0 0 1 0 1 0 0 • For a given protein, BLAST against N sequenced genomes. • If protein has a homolog in the organism n, set coordinate n to 1. Otherwise set it to 0.
Species Proteins Phylogenetic Profile
Pellegrini M, Marcotte EM, Thompson MJ, Eisenberg D, Yeates TO, Assigning protein functions by comparative genome analysis: protein phylogenetic profiles. Proc Natl Acad Sci U S A. 96(8):4285-8,. 1999