Download
1 / 32
320 likes | 465 Views
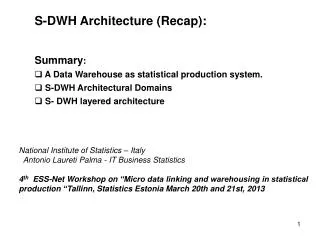
S-DWH Architecture (Recap): Summary : A Data Warehouse as statistical production s ystem. S-DWH Architectural Domains S- DWH layered architecture. National Institute of Statistics – Italy Antonio Laureti Palma - IT Business Statistics

E N D
S-DWH Architecture (Recap): • Summary: • A Data Warehouse as statistical production system. • S-DWH Architectural Domains • S- DWH layered architecture National Institute of Statistics – Italy Antonio Laureti Palma - IT Business Statistics 4th ESS-Net Workshop on “Micro data linking and warehousing in statistical production “Tallinn, Statistics Estonia March 20th and 21st, 2013 1
Data Warehouse • In an enterprise a data warehouse (DWH) is an organized information collection which stores current and historical data used for creating reports for management. • Reports are generally produced from already structured information or continual data miningcarried out by experts. • Data mining is realized by using advanced statistical methods, correlating “primary information ” from different production departments. • The delivery of reports is carried out using “secondary information” stored in specialized Data Marts. • The discovery of useful information aids business strategies which should increase efficiency in the production process.
S-DWH overview architecture Staging Area Data Warehouse Data Mart Data Integration DATA MINING PRODUCTION ETL RESOURCES secondary information secondary information DISTRIBUTION operational information primary information SALES primary information REPORTS OPERATIONAL EXTERNAL DECISION feedback
Statistical Data Warehouse • In an Enterprise the information collected in a DWH derives from different production departments. For producing Primary Information, specific Extraction Transformation and Loading (ETL) procedures are needed. • In a S-DWH (Statistical-DWA) the sources are direct data capturing or administrative archives and the ETL procedures must manage the effective statistical elaboration. • A S-DWH is a coherent information collection of current and historical data of different statistical topics and domains. • A high level of coordination is necessary both within different topics and within different operational phase activities, and between the topics and activities.
S-DWH Architectural domains • To define and enable the evolution of a S-DWH requires a definition of a framework where key principles and models can be created, communicated and improved. • A S-DWH framework comprises: • business domain to align strategic objectives and tactical demands through a common understanding of the organization. • Information architecture domain, to describe data base organization and management of data and metadata information. • technology domain, i.e. the combined set of software, hardware and networks to develop and support IT services. 5
S-DWHbusiness domain • In the business domain, key business processes that should be considered are: • Adapting or Redesigning of statistical regulation (timing and output); • Managing changes from stove-pipe approaches to a coherent S-DWH; • Redesigning operational management ( methodology and processes); • Data management (security, custodianship and ownership, data and metadata); • Quality management (assessment and control); • Software and IT infrastructure management. 6
S-DWH information domain • To organize a S-DWH information architecture, we group functionalities in four distinct layers: • access layer is designed for a wide typology of users or informatics instruments for the final presentation of the information sought; • interpretation and data analysis layer is designed for interactive non-structured human activities; • integration layer is designed for the ETL functions, which should be realized automatically or semi-automatically; • source layeris designed for storing and managing internal (surveys) or external (archives) raw data sources. 7
S-DWH information domain overview Source Layer Integration Layer Interpretation and Analysis Layer Access Layer Staging Area Data Warehouse Data Mart Data Integration CATI OPERATIONAL DECISION DATA MINING CAWI REPORTS ETL CAPI primary information secondary information operational information primary information … secondary information ADMIN
S-DWH information domain ESS-Net S-DWH functional definition: A statistical data warehouse is a central statistical data store, regardless of the data’s source, for managing all available data of interest, improving the NSI to: - (re)use data to create new data/new outputs; - perform reporting; - execute analysis; - produce the necessary information.
S-DWH information domain perform reporting produce the necessary information new outputs ACCESS LAYER INTERPRETATION AND ANALYSIS LAYER execute analysis re-use data to create new data INTEGRATION LAYER produce the necessary information SOURCES LAYER
S-DWH technology domain • In the technology domain the layered architecture reflects a conceptual organization in which we will consider the first two levels as pure statistical operational infrastructures, functional for acquiring , storing, editing and validating data, and the last two layers as the effective data warehouse, i.e. levels in which data are accessible for data analysis. • These reflect two different IT environments, an operational where we support semi-automatic computer interaction systems and an analytical, the warehouse, where we maximize human free interaction. STATISTICAL DATA WAREHOUSE DATA WAREHOUSE ACCESS LAYER INTERPRETATION AND ANALYSIS LAYER OPERATIONAL DATA INTEGRATION LAYER SOURCES LAYER
S-DWH technology domain • In the Technology domain each layer must support different process typologies: ACCESS LAYER MOLAP (Multidimensional Online Analytical Processing) uses specific analytical tools on a multidimensional data model. INTERPRETATION AND ANALYSIS LAYER ROLAP, Relational Online Analytical Processing, uses specific analytical tools on a relational dimensional data model which is easy to understand and does not require pre-compuationand storage of the information. INTEGRATION LAYER OLTP (OnLine Transaction Processing) is the typical operational activity for data editing. SOURCE LAYER Data mapping involves combining data residing in different sources and providing users with a unified view of these data.
Statistical Data Warehouse layered architecture Access Layer • The Access Layer is the layer for the final presentation, dissemination and delivery of the information sought. • This layer is designed for a wide typology of users and computer instruments. • In this layer the data organization must support automatic dissemination systems and BI-Tools (Business Intelligence). In both cases, statistical information is structured in data models at micro and macro data levels.
DWA - Access Layer • Specialized functionalities: • SDMXinterface (Statistical Data and Metadata eXchange) supports cross-border service interoperability for public administrations or organizations. • Specialized BI-Tools is an extensive category, in terms of solutions on the market, of products for query building, data-navigating, web browsing, graphics and publishing. • Office Automation tools: this is a reassuring solution for users who come for the first time to the data warehouse context, as they are not forced to learn new complex instruments. The problem is that this solution, while adequate with regard to productivity and efficiency, is very restrictive in the use of the data warehouse, since these instruments, have significant architectural and functional limitations;
DWA - Access Layer From the GSBPM we consider follow sub-processes: 7- Disseminate 7.1-”update output systems” , including re-formatting data and metadata into specific output databases. 7.2-”produce dissemination” is a sort of integration process between table, text and graphs. 7.3-”manage release of dissemination products” ensures that all elements in place for releasing. 7.4- ” promote dissemination ”, it includes wikis, blog, customer relationship management tools. 7.5- ”manage user support”ensures that customer queries are recorded and provided within agreed deadlines.
Statistical Data Warehouse layered architecture Interpretation and data analysis layer • The Interpretation and data analysis layer is specifically for statisticians and enables data mining. This is the effective data warehouse, and must support all kinds of statistical analysis on micro and macro data. • Data evaluation in this layer supports the design of any new production processes or data re-use. • The results expected of the human activities in this layer should then be statistical “services” useful for other phases of the elaboration process, from the sampling, to the set-up of instruments used in the Integration Layer until the generation of new possible statistical outputs. • Activities on the Interpretation layer improve the S-DWH capabilities.
DWA - Interpretation and data analysis layer From the GSBPM we consider follow sub-processes : 1- Specify Needs: 1.5 - check data availability 2- Design: 2.1-design outputs 2.2-design variable descriptions 2.4-design frame and sample 2.5-design statistical methodology 2.6-design production systems 4- Collect: 4.1-select sample 5- Process 5.1-integrate data; 5.5-derive new variables and units; 5.6-calculate weights; 5.7-calculate aggregate; 6- Analyze 6.1-prepare draft output; 6.2-validate outputs; 6.3-scrutinize and explain; 6.4-apply disclosure control; 6.5-finalize outputs 7- Disseminate 7.1-update output systems, 9- Evaluate 9.1- gather evaluation inputs 9.2- conduct evaluation
Statistical Data Warehouse layered architecture Integration layer • The integration layer is where all operational activities needed for all statistical elaboration processes are carried out. • This means operations carried out automatically or manually by operators to produce statistical information in a common IT infrastructure. This are recurring (cyclic) activities involved in the running of the whole or any part of a statistical production process. • Statistical elaboration should be organized in operational work flows for checking, cleaning, linking and harmonizing data-information in a common persistent area (Data Vault) where information is grouped by subject.
DWA - Integration layer • Specialized functions: • It is used for all integration and reconciliation activities of data sources. Into this layer we have the set of applications that perform the main ETL, which manages: • inconsistent coding for the same object, the consistency is obtained by coding defined by the data warehouse; • adjustment of the different units of measurement and inconsistent formats; • alignment of inconsistent labels, same object named differently. Usually the data are identified according to the definition contained in the metadata of the system. • incomplete or incorrect data; in this case operation may require human intervention to resolve issues not predictable a priori. • data linking, in which different sources enable the creation of extended, or new, units of analysis.
DWA - Integration layer From the GSBPM we consider follow sub-processes : 5- Process 5.1-integrate data; 5.2-classify & code; 5.3-review, validate & edit; 5.4-impute; 5.5-derive new variables and statistical units: 5.6-calculate weights; 5.7-calculate aggregate; 5.8-finalize data files 6- Analyze 6.1-prepare draft output; the presence of this sub-process in this layer is strictly related to regular production process, in which the measures estimated are regularly produced, as should in the STS
Statistical Data Warehouse layered architecture The Integration and Interpretation Layers are reciprocally functional to each other. • Integration layer, always prepares the elaborated information for Interpretation layer: from raw data, just uploaded into the S-DWH and not yet included in a production process, to micro/macro statistical data at any elaboration step of any production processes. • Otherwise in the interpretation layer it must be possible to easily access and analyze this micro/macro elaborated data of the production processes in any state of elaboration. This because methodologists should correct possible operational elaboration mistakes before, during and after any statistical production line, or design new elaboration processes for new surveys. • In this way the new concept or strategy can generate a feedback toward Integration layer which is able to correct, or increase the quality, of the regular production lines.
Statistical Data Warehouse layered architecture Example of reciprocally functional between The Integration and Interpretation Layers • At Estat level, official statistical output is defined by the Commission Regulation and it can be modified annually in order to reflect changes in society or the economy. • The process of defining a new statistical output is realized by statistical experts in European task forces and working groups. • Statistical experts should investigate using available primary data, at National or European levels, to support any new statistical proposal, which should involve a re-use of existing data or the design of a new process.
Statistical Data Warehouse layered architecture Example of reciprocally functional between The Integration and Interpretation Layers European task forces 1° new proposal STATISTICAL DATA WAREHOUSE 2° new regulation ACCESS LAYER INTERPRETATION AND ANALYSIS LAYER 3° new design strategy INTEGRATION LAYER 4° new output SOURCES LAYER
Statistical Data Warehouse layered architecture Case: produce the necessary information ACCESS LAYER 7 DISSEMINATE INTERPRETATION LAYER 2 DESIGN 9 EVALUATE 6 ANALYSIS INTEGRATION LAYER 5 PROCESS 3 BUILD • SOURCE LAYER 4 COLLECT
Statistical Data Warehouse layered architecture Case: re-use data to create new data ACCESS LAYER 7 DISSEMINATE INTERPRETATION LAYER 5 PROCESS 2 DESIGN 9 EVALUATE 6 ANALYSIS INTEGRATION LAYER 5 PROCESS • SOURCE LAYER 4 COLLECT
Statistical Data Warehouse layered architecture Source Layer • The Source Layer is the level in which we locate all the activities related to storing and managing internal or external data sources. • Typically, internal data are from direct data capturing carried out by CAWI, CAPI or CATI; while external data are from administrative archives, for example from Customs Agencies, Revenue Agencies, Chambers of Commerce, National Social Security Institutes.
DWA - Source layer • Specialized functions: • This level is responsible for, physically or virtually, storing the data from internal (surveys) or external (archives) sources for statistical purpose. • Typical data sources, in the context of business statistics, are data from : • specific direct data capturing CAWI, CATI, CAPI; • archive from Customs Agency; • archive from Revenue Agency; • archive from Chambers of Commerce; • archive from National Social Security Institute.
DWA - Source layer From the GSBPM we consider follow sub-processes : 4- Collect: 4.2-set up collection, ensures that the processes and technology are ready to collect data; 4.3-run collection, is where the collection is implemented, with different collection instruments being used to collect the data; 4.4-finalize collection, includes loading the collected data into a suitable electronic environment for further processing of the next layers.
Glossary: Data mining: an interdisciplinary subfield of computer science, is the computational process of discovering patterns in large data sets involving methods at the intersection of artificial intelligence, machine learning, statistics, and database systems. Data Warehouse is a central repository of data which is created by integrating data from one or more disparate sources. Data Mart is a subset of the data warehouse that is usually oriented to a specific business line or IT-Tolls. OLAP, OnLine Analytical Processing, is an approach to answering multi-dimensional analytical queries swiftly. Data Vault is a database modeling method that is designed to provide long-term historical storage of data coming in from multiple operational systems. Primary Information, is the original information which has been coded and cleaned in a common coherent environment. Secondary Information, is derived from primary information and could involve aggregate data. Business intelligence (BI) is a set of theories, methodologies, processes, architectures, and technologies that transform raw data into meaningful and useful information. BI-Tools are a set of IT-instruments used to analyze structured data and disseminates information with a topical focus. Graphics and publishing tools are able to generate graphs and tables for its users, this solution consists essentially in just a couple of steps to avoid inefficiency.
Glossary: CAPI, Computer-Assisted Personal Interviewingis an interviewing technique in which the respondent or interviewer uses a computer to answer the questions. CATI, Computer-Assisted Telephone Interviewingis a telephonesurveying technique in which the interviewer follows a script provided by a software application. CAWI, Computer-assisted web interviewingis an Internet surveying technique in which the interviewer follows a script provided in a website. Graphics and publishing tools are able to generate graphs and tables for its users, this solution consists essentially in just a couple of steps to avoid inefficiency. Interoperability is the ability of two or more systems or components to exchange information and to use the information that has been exchanged. Operational system is refered to a system that is used to process the day-to-day transactions of an organization.
Modeling the Business Architecture • In statistics, a possible standard definition of the production process is the Generic Statistical Business Process Model (GSBPM), by the 9 phases: • 1 Specify Needs, • 2 Design, • 3 Build, • 4 Collect, • 5 Process, • 6 Analyze, • 7 Disseminate, • 8 Archive, • 9 Evaluate. • Each phase is articulated by several sub statistical processes; which, according to process modeling theory, each sub-process should have a number of clearly identified attributes (input, output, owner, purpose, guide, enablers, feedback,..) 31