Delta Cross Channel Gates
110 likes | 211 Views
This study evaluates the formulation of gates in the Delta Cross Channel, proposing an alternate model for better flow simulation accuracy and reducing uncertainty in low flow rates.

Delta Cross Channel Gates
E N D
Presentation Transcript
A “gate” formulation ——— Q = g A3√ 2gDh X Matthai,H.F. 1967. Measurement of peak discharge at width contractions by indirect methods. Chapter A4 in Techniques of water-resources investigations of the United States Geological Survey.
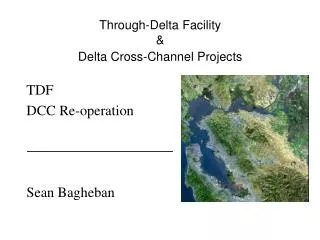
Photo courtesy of Lloyd Peterson, USBR. Figure III.2.i-1. Delta Cross Channel and gates, circa 1950’s. Sacramento River is in the foreground.
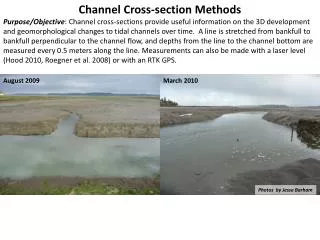
Figure III.2.i-3. USGS Monitoring locations in the vicinity of Delta Cross Channel, Sep 2003 to Nov 2004. Sacramento River above DCC Delta Cross Channel Sacramento River below GS Snodgrass Slough Mokelumne River Georgiana Slough Dead Horse Cut North Fork South Fork
Figure III.2.i-4. Comparison of field measurements (blue rhombuses) in Delta Cross Channel and simulated flow (solid lines) based on gate equation for two gate coefficients. Flow estimates at maximum and minimum water depth are also shown as dashed lines. USGS flow measurements are 15-minute averages. Stage measurements are instantaneous values. The stage difference in this plot is the average of two time-steps.
Alternative Formulation Mass balance (continuity) and energy balance (Bernoulli equation) give vd = [1 + f – (Ad / Au)2)]-½ [2 g (hu - hd)]½ where the friction loss term is assumed to take the form hf = ½ f vd2 Binomial expansion about mean water level (and dropping h.o.t.s) give Qd = Ad [2 g (hu - hd)]½ [1 + f – bo2 (1 + addhd - audhu)]-½ where the ratio of cross-sections b is assumed to take the form b = Ad / Au = bo [1 + addhd - audhu + higher order terms (h.o.t.s)] and ad ≈ wd / Ado and au ≈ wu / Auo Semi-empirical coefficients to be calibrated: f, bo2, au, ad, Ado
Figure III.2.i-5. Simulated flows in the Delta Cross Channel using open channel hydraulic formulation. Values of coefficients in Equation III.2.i-6 are given in Table III.2.i-2. Field data at 15-minute intervals span over 50 M2 tide cycles, from July 24 to August 18, 2004.
Figure III.2.i-6. Comparison of simulated flows in the Delta Cross Channel using gate-type formulation and open channel hydraulics formulation shown in Fig.III.2.i-4. Field data at 15-minute intervals span over 50 M2 tide cycles, from July 24 to August 18, 2004.
Figure III.2.i-7. Range of simulated flows in the Delta Cross Channel for a stage difference of ±¼” that estimated. Simulated flow are computed using the open channel hydraulics formulation (equation III.2.i-3). Only a small fraction of the data shown in Figs.III.2.i-4,5 are shown in this plot for better clarity. (b) At high flow rates
Figure III.2.i-7. Range of simulated flows in the Delta Cross Channel for a stage difference of ±¼” that estimated. Simulated flow are computed using the open channel hydraulics formulation (equation III.2.i-3). Only a small fraction of the data shown in Figs.III.2.i-4,5 are shown in this plot for better clarity. (a) At low flow rates
Observations – DCC gates formulation • Current formulation is inappropriate • An alternate formulation appears to simulate measured flow more closely • Uncertainty in stage difference leads to large scatter at low flows