Download
1 / 1
10 likes | 105 Views
Explore the cranial and dental predictors in mammalian studies for diet reconstruction in extinct species through a medical CT scanner analysis applied to turtle beaks. Discover how functional morphological techniques can enhance feeding strategy predictions in fossil taxa.

E N D
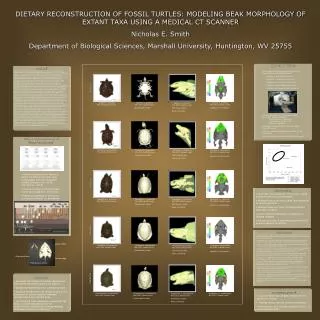
Carnivore 10 cm Apalone s. spinifera MU-3971 (dorsal view) Apalone s. spinifera MU-3971 (dorsal view) Osteological model Apalone s. spinifera MU-3971 (ventral view) Variation in millimeters Apalone s. spinifera MU-3971 (lateral view) Soft-tissue:green Bone: off-white http://www.asahi-net.or.jp/~tv4m-tkhs/geitemct04/03.JPG Omnivore 10 cm Chelydra s. serpentina MU-4121 (dorsal view) Chelydra s. serpentina MU-4121 (dorsal view) Osteological model Chelydra s. serpentina MU-4121 (ventral view) Variation in millimeters Chelydra s. serpentina MU-4121 (lateral view) Soft-tissue:green Bone: off-white Herbivore Carnivores Dietary Reconstruction of Fossil Vertebrates Omnivore Concurrent with previous studies, skull morphology is indicative of feeding strategy. Herbivore 10 cm • Previous studies have shown a direct correlation between skull morphology and diet of aquatic turtles (Claude et al., 2004; Herrel et al., 2002) • However, these techniques have never been applied to fossil taxa • Feeding strategies of fossil taxa are based primarily on phylogeny Pseudemys c. concinna MU-3965 (dorsal view) Pseudemys c. concinna MU-3965 (dorsal view) Osteological model Pseudemys c. concinna MU-3965 (ventral view) Variation in millimeters Graptemys geographica MU-3761 (lateral view) Soft-tissue:green Bone: off-white • References • Anthony, M. R. L., and R. F. Kay. 1993. Tooth form and diet in ateline and alouattine primates: reflections on the comparative method. American Journal of Science 293-A:356-382. • Buhlmann, K. A., and M. R. Vaughan. 1991. Ecology of the turtle Pseudemys concinna in the New River, West Virginia. Journal of Herpetology 25:72-78. • Kay, R. F. 1975. The functional adaptations of primate molar teeth. American Journal of Physical Anthropology 42:195-215. • Claude, J., Pritchard, P., Tong H., Paradis, E., and J. C. Auffray. 2004. Ecological correlates and evolutionary divergence in the skull of turtles: a geometric morphometric assessment. Systematic Biology 53(6):933–948. • Cochran, P. A., and D.R. McConville. 1983. Feeding by Trionyx spiniferus in backwaters of the upper Mississippi River. Journal of Herpetology 17:82-86. • Herrel, A., J. C. O’Reilly, and A. M. Richmond. 2002. Evolution of bite performance in turtles. Journal of Evolutionary Biology 15:1083–1094. • Punzo, F. 1975. Studies on the feeding behavior, diet, nesting habits, and temperature relationships of Chelydra serpentina oosceola. (Chelonia: Chelydridae). Journal of Herpetology 9:207-210. • Strait, S.G. 2001 Dietary reconstruction of small-bodied omomyoid primates. Journal of Vertebrate Paleontology 21(2):322-334. • 1993a. Differences in occlusal morphology and molar size in frugivores and faunivores. Journal of Human Evolution 25:471-484. • White, D., Jr., and D. Moll. 1992. Restricted diet of the Common Map Turtle Graptemys geographica in a Missouri stream. Journal of Herpetology 25:493-494. • Vogt, R. C. 1980. Natural history of the map turtles Graptemys pseudogeographica and G. ouachitensis in Wisconsin. Tulane Stud. Zool. Bot. 22:17-48. Carnivore Labial ridge 10 cm Rhamphotheca Graptemys geographica MU-3761 (dorsal view) Graptemys geographica MU-3761 (dorsal view) Osteological model Graptemys geographica MU-3761 (ventral view) Variation in millimeters Pseudemys c. concinna MU-3965 (lateral view) Soft-tissue: green Bone: off-white Tomial ridge Triturating surface http://research.amnh.org/~esg/ Carnivore 10 cm Graptemys p. ouachitensis MU-1922 (dorsal view) Graptemys p. ouachitensis MU-1922 (dorsal view) Osteological model Graptemys p. ouachitensis MU-1922 (ventral view) Graptemys p. ouachitensis MU-1922 (lateral view) Soft-tissue: green Bone: off-white DIETARY RECONSTRUCTION OF FOSSIL TURTLES: MODELING BEAK MORPHOLOGY OF EXTANT TAXA USING A MEDICAL CT SCANNER Nicholas E. Smith Department of Biological Sciences, Marshall University, Huntington, WV 25755 Materials & Methods Abstract Cranial and dental morphology of mammals serve as dietary predictors, and paleontologists use comparative morphology to reconstruct the diet of extinct species. In turtles, however, phylogeny has traditionally been the basis for dietary predictions. The goal of this study was to apply functional morphological techniques from mammalian studies to the beaks of turtles, and assess the use of a medical CT scanner for this application. By establishing dietary cranial characters among extant feeding strategists, it may then be possible to more accurately predict what fossil taxa may have eaten. Turtles lack teeth, and therefore their shearing surfaces are formed via a keratinized beak, the rhamphotheca. Unfortunately, these keratinous sheaths do not fossilize, and the difficulty in this experiment was matching structures seen on the rhamphotheca to those of the maxillae and mandible. To assess this fit, a Computed Tomography (CT) scanner was used to generate models of preserved specimens, which were imported into a 3-D quality control program. The taxa examined are endemic to West Virginia, and were chosen based upon feeding strategies: Apalone s. spinifera (carnivore); Pseudemys c. concinna (herbivore); Chelydra s. serpentina (omnivore); Graptemys geographica, (molluscivore); Graptemys p. ouachitensis (insectivore). One representative adult male was digitized per group, using a GE Lightspeed CT scanner at Cabell Huntington Hospital (CHH). The skulls were scanned at a slice thickness of 0.49 mm using a bone algorithm, and the DICOM file was imported into 3D-Doctor for image processing. In this program, the rhamphotheca were isolated from the underlying bone and soft tissue using differences in pixel intensity. Three-dimensional surface files were then exported into Geomagic Qualify, where the rhamphotheca was superimposed with the cranium, and a 3-D comparison was made. Morphometric analyses were performed in 3D-Doctor, and bone densities were taken using Voxtool 3.0.04v at CHH. Not only did CT scanning provide a means of acquiring data inaccessible via other forms of microscopy, collaboration with CHH and the Marshall University School of Medicine afforded an opportunity to examine the feeding apparatuses of these taxa without dissecting the specimens. It was determined that the resolution of the medical CT scanner was insufficient for modeling microstructures, however, the internal structures and density measurements proved invaluable. Even on this small sample, trends in cranial morphology are apparent among the dietary groups, and warrant further investigation. Coupled with a higher resolution instrument, like a Micro-CT scanner, this technique yields tremendous possibilities for functional morphological applications. • Five museum specimens were selected and scanned based on feeding strategy: • Apalone s. spinifera (carnivore) • Chelydra s. serpentina (omnivore) • Pseudemys c. concinna (herbivore) • Graptemys geographica (carnivore) • Graptemys p. ouachitensis (carnivore) • GE Lightspeed Pro 16 CT Scanner (Cabell Huntington Hospital MUSOM) -slice thickness: 0.625 mm -voxel volume: 0.218 mm3–standard algorithm • Slice data rendered into 3D surface models using 3D-Doctor • STL file imported into Geomagic Studio for 3D comparison • Linear and area measurements taken in ImageJ • Conclusions • Even with low resolution, CT permits cranial analyses previously unattainable • Rhamphotheca can be isolated and compared to underlying bone • Ossified beak is a “cast” of rhamphotheca with little variation • Gross cranial morphology is indicative of feeding strategy • Future work with a High-Resolution Micro-CT scanner appears promising • Objectives • Generate 3D models of feeding apparatuses from turtle specimens using a CT scanner • Isolate rhamphotheca from underlying bone • Because keratin does not readily fossilize, it is necessary to assess variation between rhamphotheca and ossified beak • If underlying bone adequately represents the beak, it is then possible to test for form/function relationship between feeding strategies and bony morphology • Acknowledgments • Suzanne Strait, David Neff, Michael Norton advise and review • Thomas Pauley loaning museum specimens • Pamela Haun and Carolyn Holschuh (CHH) CT scanning assistance


