Quantative Structure-Activity Relationships
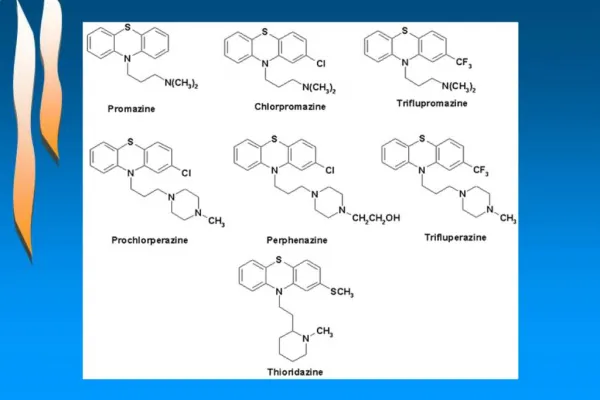
QSAR. Quantative Structure-Activity Relationships. Why QSAR?. The number of compounds required for synthesis in order to place 10 different groups in 4 positions of benzene ring is 10 4


Quantative Structure-Activity Relationships
E N D
Presentation Transcript
QSAR Quantative Structure-Activity Relationships
Why QSAR? • The number of compounds required for synthesis in order to place 10 different groups in 4 positions of benzene ring is 104 • Solution: synthesize a small number of compounds and from their data derive rules to predict the biological activity of other compounds.
Compounds + biological activity QSAR New compounds with improved biological activity QSAR and Drug Design
What is QSAR? • A QSAR is a mathematical relationship between a biological activity of a molecular system and its geometric and chemical characteristics. • QSAR attempts to find consistent relationship between biological activity and molecular properties, so that these “rules” can be used to evaluate the activity of new compounds.
Statistical Concepts Input: n descriptors P1,..Pn and the value of biological activity (EC50 for example) for m compounds.
Statistical Concepts • The problem of QSAR is to find coefficients C0,C1,...Cn such that: Biological activity = C0+(C1*P1)+...+(Cn*Pn) and the prediction error is minimized for a list of given m compounds. • Partial least squares (PLS) is a technique used for computation of the coefficients of structural descriptors.
3D-QSAR • Structural descriptors are of immense importance in every QSAR model. • Common structural descriptors are pharmacophores and molecular fields. • Superimposition of the molecules is necessary. • 3D data has to be converted to 1D in order to use PLS.
3D-QSAR Assumptions • The effect is produced by modeled compound and not it’s metabolites. • The proposed conformation is the bioactive one. • The binding site is the same for all modeled compounds. • The biological activity is largely explained by enthalpic processes. • Entropic terms are similar for all the compounds. • The system is considered to be at equilibrium, and kinetics aspects are usually not considered. • Pharmacokinetics: solvent effects, diffusion, transport are not included.
QSAR and 3D-QSAR Software • Tripos – CoMFA, VolSurf • MSI – Catalyst, Serius Docking Software • DOCK – Kuntz • Flex – Lengauer • LigandFit – MSI Catalyst
3D molecular fields • A molecular field may be represented by 3D grid. • Each voxel represents attractive and repulsive forces between an interacting partner and a target molecule. • An interacting partner can be water, octanol or other solvents.
Common 3D molecular fields • MEP – Molecular Electrostatic Potential (unit positive charge probe). • MLP – Molecular Lipophilicity Potential (no probe necessary). • GRID – total energy of interaction: the sum of steric (Lennard-Jones), H-bonding and electrostatics (any probe can be used). • CoMFA – standard: steric and electrostatic, additional: H-bonding, indicator, parabolic and others.
Comparative Molecular Field Analysis (CoMFA) - 1988 • Compute molecular fields grid • Extract 3D descriptors • Compute coefficients of QSAR equation
CoMFA molecular fields • A grid wit energy fields is calculated by placing a probe atom at each voxel. • The molecular fields are: Steric (Lennard-Jones) interactions Electrostatic (Coulombic) interactions • A probe is sp3carbon atom with charge of +1.0
CoMFA 3D-QSAR • Each grid voxel corresponds to two variables in QSAR equation: steric and electrostatic. • The PLS technique is applied to compute the coefficients. Problems: • Superposition: the molecules must be optimally aligned. • Flexibility of the molecules.
3D-QSAR of CYP450cam with CoMFA • Training dataset from 15 complexes of CYP450 with different compounds was used. • The alignment of the compounds was done by aligning of the CYP450 proteins from the complexes.
3D-QSAR of CYP450cam with CoMFA Maps of electrostatic fields: BLUE - positive chargesRED - negative charges Maps of steric fields:GREEN - space filling areas for best KdYELLOW - space conflicting areas
VOLSURF The VolSurf program predicts a variety of ADME properties based on pre-calculated models. The models included are: • drug solubility • Caco-2 cell absorption • blood-brain barrier permeation • distribution
VOLSURF • VolSurf reads or computes molecular fields, translates them to simple molecular descriptors by image processing techniques. • These descriptors quantitatively characterize size, shape, polarity, and hydrophobicity of molecules, and the balance between them.
VOLSURF Descriptors • Size and shape: volume V, surface area S, ratio volume surface V/S, globularity S/Sequiv (Sequiv is the surface area of a sphere of volume V). • Hydrophilic: hydrophilic surface area HS, capacity factor HS/S. • Hydrophobic: like hydrophilic LS, LS/S. • Interaction energy moments: vectors pointing from the center of the mass to the center of hydrophobic/hydrophilic regions. • Mixed: local interaction energy minima, energy minima distances, hydrophilic-lipophilic balance HS/LS, amphiphilic moments, packing parameters, H-bonding, polarisability.
VOLSURF hydrophobic (blue) and hydrophilic (red) surface area of diazepam.
Catalyst • Catalyst develops 3D models (pharmacophores) from a collection of molecules possessing a range of diversity in both structures and activities. • Catalyst specifies hypotheses in terms of chemical features that are likely to be important for binding to the active site. • Each feature consists of four parts: • Chemical function • Location and orientation in 3D space • Tolerance in location • Weight
Catalyst Features • HB Acceptor and Acceptor-Lipid • HB Donor • Hydrophobic • Hydrophobic aliphatic • Hydrophobic aromatic • Positive charge/Pos. Ionizable • Negative charge/Neg. Ionizable • Ring Aromatic
Catalyst HipHop Feature-based pharmacophore modeling: • uses ONLY active ligands • no activity data required • identifies binding features for drug-receptor interactions • generates alignment of active leads • the flexibility is achieved by using multiple conformers • alignment can be used for 3D-QSAR analysis
Catalyst HipoGen Activity-based pharmacophore modeling: • uses active + inactive ligands • activity data required (concentration) • identifies features common to actives missed by inactives • used to “predict” or estimate activity of new ligands
Catalyst CYP3A4 substrates pharmacophore Hydrophobic area, h-bond donor, 2 h-bond acceptors Saquinavir (most active compound) fitted to pharmacophore
Catalyst CYP2B6 substrates pharmacophore 3 hydrophobic areas, h-bond acceptor 7-ethoxy-4-trifluoromethylcoumarin fitted to pharmacophore
Catalyst Docking – Ligand Fit • Active site finding • Conformation search of ligand against site • Rapid shape filter determines which conformations should be scored • Grid-based scoring for those conformations passing the filter
Catalyst Docking – Ligand Flexibility • Monte Carlo search in torsional space • Multiple torsion changes simultaneously • The random window size depends on the number of rotating atoms
Catalyst Docking – Scoring pKi = – c – x (vdW_Exact/ Grid_Soft) + y (C+_pol) – z (Totpol^ 2) • vdW = softened Lennard-Jones 6-9 potential • C+_pol = buried polar surface area involved in attractive ligand-protein interactions • Totpol^ 2 = buried polar surface area involved in both attractive and repulsive protein-ligand interactions
3D-QSAR of CYP450cam with DOCK Goal: • Test the ability of DOCK to discriminate between substrates and non-substrates. Assumption: • Non-substrate candidate is a compound that doesn’t fit to the active site of CYP, but fits to the site of it’s L244A mutant.
Methods • Docking of 20,000 compounds to ‘bound’ structure of CYP and L244A mutant. • 11 substrate candidates were selected from 500 high scoring compounds for CYP. • 6 non-substrate candidates were selected from a difference list of L244A and CYP. • Optimization of compounds 3D structures by SYBYL molecular mechanics program and re-docking. As a result 2 compounds move from “non-substrate” list to “substrate” list and one in the opposite direction.
Prediction Results • All compounds predicted as “non-substrates” shown no biological activity. • 4 of the 11 molecules predicted as “substrates” were found as non-substrates. • The predictions of DOCK are sensitive to the parameter of minimum distance allowed between an atom of the ligand and the receptor (penetration constrains).
References • Cruciani et al., Molecular fields in quantitative structure-permeation relationships: the VolSurf approach, J. Mol. Struct. (Theochem), 2000, 503:17-30 • Cramer et al.,Comparative Molecular Field Analysis (CoMFA). 1. Effect of shape on Binding of steroids to Carrier proteins, J. Am. Chem. Soc. 1988, 110:5959-5967 • Ekins et al., Progress in predicting human ADME parameters in silico, J. Pharmacological and Toxicological Methods 2000, 44:251-272 • De Voss et al., Substrate Docking Algorithms and Prediction of the Substrate Specifity of Cytochrome P450cam and its L244A Mutant, J. Am. Chem. Soc. 1997, 119:5489-5498 • Ekins et al., Three-Dimensional Quantative Structure Activity Relationship Analyses of Substrates for CYP2B6, J. Pharmacology and Experimental Therapeutics, 1999, 288:21-29 • Ekins et al., Three-Dimensional Quantative Structure Activity Relationship Analysis of Cytochrome P-450 3A4 Substrates, J. Pharmacology and Experimental Therapeutics, 1999, 291:424-433 • Sechenykh et al., Indirect estimation of protein-ligand complexes Kd in database searching, www.ibmh.msk.su/qsar/abstracts/sech.htm