Download
1 / 33
330 likes | 493 Views
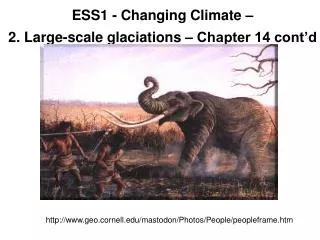
ESS1 - Changing Climate – 2. Large-scale glaciations – Chapter 14 cont’d. http://www.jamestown-ri.info/glaciation.htm. http://www.geo.cornell.edu/mastodon/Photos/People/peopleframe.htm. Outline. Announcements – review materials on line Evidence of conditions in the last glaciation

E N D
ESS1 - Changing Climate – 2. Large-scale glaciations – Chapter 14 cont’d http://www.jamestown-ri.info/glaciation.htm http://www.geo.cornell.edu/mastodon/Photos/People/peopleframe.htm
Outline Announcements – review materials on line Evidence of conditions in the last glaciation Successive Pleistocene Glacial/Interglacial Ages – orbital controls Climate feedbacks amplifying orbital controls
Evidence of Glaciations in the Past Last 20 million years Earth is presently in a cool period – dark bands show times when large ice sheets were present on continents. However, during much of Earth’s history, there is no evidence for ice ages – warmer oceans, warmer conditions. We will come back to this later. Possible causes? Faint young sun? Changes in greenhouse gases? Changes in the positions of the continents? Millions of years before present Snowball Earth?
Geologic evidence for Glaciation Striations (grooves) in bedrock in an area that now has no ice Ice thickness likely was up to a mile thick in areas like this.
Till deposits – poorly sorted, angular rocks that were moved by glaciers
Moraine left by retreating glacier – Mt. Cook, New Zealand Radiocarbon dating of plants that were ‘ploughed under’ gives the timing
Glacial erratic boulder – Yellowstone National Park – Boulder had to have been dropped by a melting glacier
Erratic Boulders found in ocean sediments are evidence of ice rafted debris
Ice cores from Greenland and Antarctica contain ice that is as much as 400,000- years old Vostok
What is preserved in ice? • Gases – trapped in bubbles in ice – past atmospheric composition • Oxygen isotope composition – proxy for temperature (see next pages) • Dust – dustier atmosphere
Oxygen Isotopes Oxygen has two naturally occurring isotopes: 99.762% 16O 8 protons, 8 neutrons 0.200% 18O 8 protons, 10 neutrons When water is evaporated, the water containing the lighter isotope (H216O) evaporates faster than water containing the heavy isotope (H218O). Building a large ice sheet on continents requires evaporation of a lot of water from the ocean, which then accumulates as ice on land. The ice will be enriched in H216O, while the water left behind will be enriched in H218O. The 18O/16O ratio of water in glacial times must therefore have been higher than in present times. Luckily it gets preserved in the shells of organisms of in the ice on continents, so we can measure it
Oxygen isotopes are used in two ways: • A measure of ice volume • A measure of the temperature at which precipitation occurs (or the temperature shells are made in seawater) • If you know (1), you can infer (2)
glaciation glaciation glaciation glaciation Carbon dioxide concentrations have varied in concert with temperature Amplifying feedback?
Feedbacks that might be operating to amplify the orbital signals Positive feedback Surface Temperature Amount of surface covered by ice Carbon dioxide in atmosphere Increased reflectance
The Last Glaciation Last glaciation: 70,000 - 10,000 years ago This last glaciation, which peaked about 20,000 years ago, was one in a series of glaciations that took place during the Pleistocene Epoch (2 million to 10,000 years ago) Figure 14., Skinner et al., 1999,
Feedbacks that might be operating to amplify the orbital signals Positive feedback Greenhouse gas Surface Temperature Amount of surface covered by ice Observation – But mechanism? Carbon dioxide in atmosphere
What was the climate like in the Last Glacial Maximim (about 20,000 years ago) • Continental Ice Sheets expanded • Sea Level – 135m lower • Ocean 18O higher, Salinity higher, circulation changed (no NADW formation) • Temperature • Land cooler (average 5 degrees C, of the order of what is predicted for warming from CO2) • Pollen, plant distribution • Dissolved gases in groundwater • Surface oceans mostly only 2 degrees cooler (Celcius) but some areas cooled more • Oxygen isotopes in plankton shells • Different distribution of warm and cold dwelling species of plankton • Precipitation – rainforests were drier grasslands • Atmospheric Composition • Lower in greenhouse gases – colder air holds less water; lower CO2 and methane
The Last Glaciation: Temperature Changes • Evidence comes from • Relationship between modern snowline of modern glacial extent to ice age glacial extent (assume same snowline relationship and infer temperature) • Fossil pollen: vegetation implies a certain climate • Oxygen isotopes • Existence of permafrost-controlled landforms • Fossils in deep sea sediments http://www.elmhurst.edu/~chm/vchembook/globalwarmA.html
The Last Glaciation: Temperature Changes Figure C14.1, Skinner et al., 1999 Average SST differences only about 2 °C Regional differences, e.g. Northern Oceans, quite large Figure 14.1, Skinner et al., 1999
The Last Glaciation: Ice Age Vegetation Much information on ice-age vegetation comes from fossil pollen Deposited in lakes, ponds, bogs, and protected from decomposing in the wet environment Core samples from sediments reveal the assemblage of local vegetation If modern analogs can be identified, then these climatological conditions existed in that region at that time Figure 14.1, Skinner et al., 1999 Figure 14.12, Skinner et al., 1999
The Last Glaciation: Ice Age Vegetation Figure 14.1, Skinner et al., 1999 Figures 14.9, 14.10, Skinner et al., 1999
The Last Glaciation: Ice Age Vegetation Changing distribution of Spruce, Hemlock and Elm based on fossil pollen data 18,000 years ago to present Darker color indicates greater relative abundance Gives idea of how fast vegetation zones can move Figure 14.1, Skinner et al., 1999 Figure 14.14, Skinner et al., 1999
Paige Museum web site - http://www.tarpits.org/ ….” the Pleistocene climate of Los Angeles was not drastically different from the present day. In fact, the best available evidence points to a climate similar to coastal Monterey or San Francisco, California. This climate is slightly more humid and cooler than one typically associated with the present day environment of the Los Angeles area….”
The Last Glaciation: Dusty Atmosphere • Mid-latitudes were windier and duster then today • Evidence from dust layers in Greenland ice cores: • dust percentage increases significantly in the part of cores corresponding to last glaciation • Source was central Asian deserts and valleys of meltwater streams south of N. American ice sheet • Other evidence: • Glacial-age loess (fine, wind-borne dust produced when glacial ice pulverizes underlying bedrock into powder) deposits east (downwind) of former meltwater streams • Thick loess deposits of central China lie east of the central Asian deserts • These deposits are separated by soils formed during interglacial time periods, when climate was more similar to today Chinese Loess Deposits http://whyfiles.org/shorties/100dust_china/
Loess – large deposits of dust formed during the last glaciation
The Last Glaciation: Sea and Lake Level Changes Glacial Lake Bonneville • Previously discussed sea level changes • Falling sea levels caused rivers to deepen their valleys and transport river mouth deposits to new mouths • Enlargement of existing lakes, creation of new ones • e.g. Great Salt Lake was occupied by gigantic glacial Lake Bonneville • 300 m deeper than Great Salt Lake, covered 1/3 of present-day Utah • Horizontal benches or terraces (Figure 14.11 in Skinner et al) mark ancient shorelines of this vast, Pleistocene lake http://www.ugs.state.ut.us/online/PI-39/pi39pg01.htm
Successive Pleistocene Glacial and Interglacial Periods Seafloor sediment core biota (warm vs cold); oxygen isotope ratios; calcium carbonate ratios all point to successive glacial-interglacial periods Over last 800,000 years, duration is 100,000 years Prior to this, glacial duration is 40,000 years Changes in duration and magnitude of peaks points to fundamental change in Earth system Figure 14.1, Skinner et al., 1999 Figure 14.16, Skinner et al., 1999
Milankovitch Cycles Small changes in Earth’s orbit around Sun (eccentricity), wobble (precision), and tilt can have large impact on climate.
Glaciation Prior to Pleistocene Oxygen isotope data show that ocean has grown colder over last 50 million years. There was no ice cap in Antarctica or Greenland before about 35 million years ago In parallel, glaciers began moving out from Antarctic highlands and reached the sea; by 12-10 million years ago, Antarctic ice sheet had formed From then on, mountain glaciers begin forming, but large ice sheets don’t appear in N. Hem. Until about 2.5 million years ago The Mesozoic (248-65 million years ago) was a long interval of relatively mild land and sea temperatures, and large-scale glaciation apparently did not occur Figure 14.1, Skinner et al., 1999 Figure 14.17, Skinner et al., 1999
The Warm Middle Cretaceous • Around 100 million years ago, climate was one of the warmest in Earth history • Coral reefs grew much closer to the poles • Warm water fauna were widespread • Peat deposits formed at high latitudes • Dinosaurs ranged north of the Artic Circle • Sea level was 100 - 200 m higher than today, implying an absence of ice sheets • Global average temperatures are estimated to be 6-14°C warmer • Equator to pole temperature difference was 17-26 °C compared to 41 °C today Figure 14.18, Skinner et al., 1999 Figure 14.1, Skinner et al., 1999
The Warm Middle Cretaceous • Paleoclimate computer model simulations suggest that a combination of changes in geography, ocean circulation and atmospheric composition (relative to the present) explain the differences • Arrangement of continents affects albedo (reflected solar energy) and ocean circulation, can account for about 5 °C of the warming • How about the rest of the warming? Could differences in ocean heat transport explain the high latitude warming? • Models suggest that the answer lies in CO2 • Model simulations show that an 8-fold CO2 increase can account for the warming • geochemical reconstructions point to a ten-fold increase Figure 14.1, Skinner et al., 1999 Figure 14.19, Skinner et al., 1999