Download
1 / 34
340 likes | 505 Views
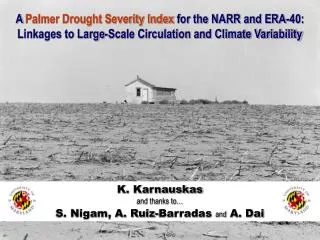
A Palmer Drought Severity Index for the NARR and ERA-40: Linkages to Large-Scale Circulation and Climate Variability. K. Karnauskas and thanks to…. S. Nigam, A. Ruiz-Barradas and A. Dai. Outline. Lightning review of drought and PDSI Algorithm implementation and new developments

E N D
A Palmer Drought Severity Index for the NARR and ERA-40: Linkages to Large-Scale Circulation and Climate Variability K. Karnauskas and thanks to… S. Nigam, A. Ruiz-Barradas and A. Dai
Outline • Lightning review of drought and PDSI • Algorithm implementation and new developments • (read: my life for the past few months… over 1,700 lines of code later) • 3. Results • a. Spatial patterns • b. Interannual variability • 4. Linkages with general circulation, climate variability
Basic Drought Review • A deficiency in precipitation, with respect to the climatologically appropriate soil moisture conditions. • Can be short term or long term. Recall that there can be short term moist spells in the midst of a long term drought. • Short-term often related to an anomalous weather event, and long term often related to anomalies in large-scale circulation. • Different regions respond to precipitation in different ways. 2” below normal monthly rainfall in one region could mean substantial drought, whereas other regions might be able to withstand 10” below normal.
Basic PDSI Review • Formulated by Wayne Palmer of the U.S. Weather Bureau in 1965. • A very complicated index that that tells you the severity of meteorological drought in a location. • Ranges from –4 (extreme drought) to +4 (extremely moist) • Most widely used drought index in the US. • Takes a supply-and-demand approach to the surface water balance. To summarize the derivation… Z = K [ P – ( αPE + βPR + γPRO – δPL ) ]
Advantages of the PDSI • All that is needed is precipitation, temperature, available water content, and a little information specific to the locale (e.g. about regional climate and soil type). Do not need streamflow. • PDSI is a good measure of long-term drought; order several months. • In addition to drought, PDSI provides information about wet spells. • Standardization to local climate means we can look at a map and compare the conditions in TX with the conditions in MA and we are still comparing apples to apples. • Built in timescale so good for “real” drought… not fluctuations within a single month.
Disadvantages to PDSI • Not good for short-term drought, e.g. weeks. • Standardization process has little statistical or physical justification (Alley, 1984). • Not good if your region or “climate division” isn’t very homogeneous. • Precipitation in one month can have a large effect on the PDSI of previous months (Alley, 1984). • Computation of the coefficients highly sensitive to base period used (Karl, 1986). • Not useful in calculating supplies of snow-locked water, so much better east of the continental divide (USGS FAQ). • Does not utilize potentially useful streamflow information. • In the surface water balance used, no runoff is allowed until the surface and subsurface layers are full… so underestimates runoff. x x x x
Other Drought Indices • Palmer-Z Just the monthly anomaly of conditions via PDSI. Good for looking at “now.” • SPI Standardized precipitation index. Tells you the probability of precipitation on any time scale. Good for looking into future. • PHDI Palmer hydrological drought index. Gauges groundwater and reservoirs, for even longer timescales than PDSI itself. • CMI Crop Moisture Index. For short-term drought on order of weeks. • SWSI Surface Water Supply Index. Good for places where snow is a • big player in the surface water supply, e.g. Colorado. • The CPC also has many experimental and blended types of indices. • Hey, there is always “inches below normal” or “percent below normal.”
Algorithm Development & Implementation Goal of Dai et al. (2004)Develop and implement the PDSI algorithm, using any data available, to produce the best possible representation of PDSI over the global domain and back to 1870. My objectiveTake the NARR and all that the NARR offers, and develop an implementation of the PDSI, minimizing external data, to assess the suitability of the NARR to hydroclimate studies as they relate to meteorological drought. Same for ERA-40. NARR Temperature Precipitation Evapotranspiration Potential evapotranspiration Surface runoff Subsurface runoff 0-2m soil moisture ERA-40 Temperature Precipitation Evapotranspiration Potential evapotranspiration Surface Runoff Subsurface runoff Soil layer 1 moisture Soil layer 2 moisture Soil layer 3 moisture Soil layer 4 moisture External Soil moisture capacity (ORNL)
T H E C O D E Calculate some climatologies, and the climate coefficients (alpha, beta, etc), and “potential” ratios NARR: Set up variables Open files Read in data Tons of conversions Set up water balance Split up NARR’s soil layer Deal with potential loss, Recharge, etc. Calculate local climate coefficients Determine precip deficit ERA-40: Implement PE scheme Calculate Z and PDSI, write to files and close up Z(t) = K(m) * [ P(t) – ( α(m)*PE(t) + β(m)*PR(t) + γ(m)*PRO(t) – δ(m)*PL(t) ) ] PDSI(t) = 0.9 * PDSI(t-1) + 0.3 * Z(t)
Long Term Mean/ Annual Average PDSI Dai NARR ERA-40
Long Term Mean/ Annual Average Palmer-Z NARR ERA-40
PDSI 12/1985 NOAA Dai NARR ERA-40
PDSI 7/1992 NOAA Dai NARR ERA-40
Palmer-Z 3/1987 (no Dai Palmer-Z) NOAA NARR ERA-40
PDSI June 1988 NOAA Dai NARR ERA-40
Palmer-Z June 1988 (no Dai Palmer-Z) NOAA NARR ERA-40
PDSI / Interannual Variability STANDARD DEVIATION Sigma-based indices: 35°N – 47°N x 105°W – 95°W Dai NARR ERA-40
PDSI / Interannual Variability STANDARD DEVIATION Sigma-based indices: 35°N – 47°N x 105°W – 95°W
NORMALIZED Dai NARR ERA-40 R=0.55 (99.9%) R=-0.50 (99.9%) LOW PASS FILTERED 0.083 mo-1 LOW PASS FILTERED 0.083 mo-1 R=0.64 (99.5%)
NORMALIZED Dai NARR ERA-40 R=0.55 (99.9%) R=-0.50 (99.9%) Power spectra Autocorrelations
PDSI Variability / 1st EOF Scaled by RMS of PC Remember the sign of eigenvector is arbitrary 1stPrinciple Component intercorrelations: Dai vs. NARR ~0 Dai vs. ERA-40 0.34 * NARR vs. ERA-40 0.65 * * Significant at the 99.9% confidence level. Dai 23.3% NARR 21.3% ERA-40 26.3%
PDSI Variability / 2nd EOF Scaled by RMS of PC Remember the sign of eigenvector is arbitrary 2ndPrinciple Component intercorrelations: Dai vs. NARR -0.12 Dai vs. ERA-40 -0.26 * NARR vs. ERA-40 0.61 * * Significant at the 99.9% confidence level. Dai 17.1% NARR 17.1% ERA-40 20.2%
PDSI Variability / 3rd EOF Scaled by RMS of PC Remember the sign of eigenvector is arbitrary 3rdPrinciple Component intercorrelations: Dai vs. NARR 0.39 * Dai vs. ERA-40 ~0 NARR vs. ERA-40 0.49 * * Significant at the 99.9% confidence level. Dai 7.8% NARR 9.1% ERA-40 9.6%
Palmer-Z Variability / EOFs Scaled by RMS of PC Remember the sign of eigenvector is arbitrary NARR 1st EOF (25.3%) NARR 2nd EOF (9.7%) NARR 3rd EOF (7.6%) ERA-40 1st EOF (33.8%) ERA-40 2nd EOF (9.4%) ERA-40 3rd EOF (8.3%)
PDSI / General Circulation Linkages Pacific Decadal Variability (PDO)… Dai PC2 vs. PDO -0.25 * NARR PC2 vs. PDO -0.24 * …after 1987 -0.49 * * Significant at the 99.9% confidence level. Courtesy JISAO U. Washington
NARR 1st EOF (25.3%) Courtesy JISAO, U. Washington ? PDSI / General Circulation Linkages Arctic Oscillation (AO)… NARR PDSI Index vs. AO 0.14 * NARR PC1 vs. AO 0.12 * NARR EOF1 similar to AO? (click) ERA-40 PDSI Index vs. AO 0.28 ** ERA-40 PC1 vs. AO 0.11 Very small correlations with ENSO, PNA * Significant at the 95% confidence level. ** Significant at the 99.9% confidence level. Courtesy JISAO U. Washington
References Alley, W. M. 1984. The Palmer Drought Severity Index: Limitations and assumptions. J. Climate and Appl. Meteor. 23:1100–1109. Barlow, M., S. Nigam, and E. H. Berbery, 2001: ENSO, Pacific decadal variability, and U.S. summertime precipitation, drought, and streamflow. J. Climate, 14, 2105-2128. Black, T.L., 1994: The new NMC mesoscale eta model: Description and forecast samples. Weather Forecasting, 9, 265-278. Dai, A., Trenberth, K. E. and T. Qian, 2004: A Global Dataset of Palmer Drought Severity Index for 1870-2002: Relationship with Soil Moisture and Effects of Surface Warming. J. Hydrometeor., 5, 1117-1130. European Centre for Medium-Range Weather Forecasts, 2002: The ERA-40 Archive. Reading, ECMWF, 40 pp. Heim, Jr., R. R., 2002: A review of Twentieth-Century drought indices used in the United States. Bull. Amer. Meteor. Soc., 83, 1149-1165. Kalnay, E. and Coauthors, 1996: The NCEP/NCAR Reanalysis 40-year Project. Bull. Amer. Meteor. Soc., 77, 437-471. Karl, T. R., 1986: The sensitivity of the Palmer Drought Severity Index and Palmer's Z-Index to their calibration coefficients including potential evapotranspiration. J. Climate Appl. Meteor., 25, 77-86. Messinger, F. G., and Coauthors, 2004: NCEP North American Regional Reanalysis. Paper P1.1, 15th Symp. on Global Change and Climate Var., Comb. Preprints CD-ROM, Amer. Meteor. Soc., Seattle, WA, 11-15 January. Nigam, S., M. Barlow, and E. H. Berbery, 1999: Analysis links Pacific decadal variability to drought and streamflow in United States. EOS 80: 621, 622, 625. Palmer, W. C, 1965: Meteorological Drought. Res. Paper No.45, 58pp., Dept. of Commerce, Washington, D.C. Riebsame, W. E., S. A. Changnon, and T. R. Karl, 1991: Drought and natural sesources management in the United States: impacts and implications of the 1987-89 drought. Westview Press 11-92. Schubert, S., Suarez, M., Pegion, P., Koster, R., J. Bachmeister, 2004: Causes of Long Term Drought in the U.S. Great Plains. J. Clim. 17, 485. Tianwen, C. and C. Weixin, 1980: Measurement and estimation of field evaporation and potential evaporation, Collected Geographical Papers, Science Press, Beijing. Wells, N., Goddard, S., and M. J. Hayes, 2004: A Self-Calibrating Palmer Drought Severity Index. J. Climate, 17(12), 2335-2351.