Download
1 / 1
10 likes | 99 Views
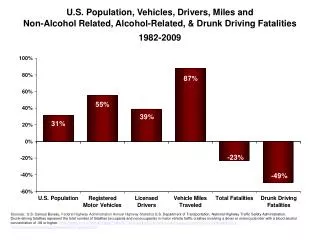
Explore the shifting patterns of non-alcohol and alcohol-related driving fatalities in the United States from 1982 to 2009. Analyze data on drivers, miles traveled, and population from trusted sources including U.S. Census Bureau and NHTSA reports.

E N D
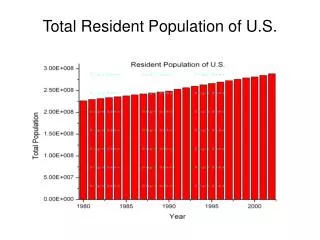
U.S. Population, Vehicles, Drivers, Miles and Non-Alcohol Related, Alcohol-Related, & Drunk Driving Fatalities 1982-2009 Sources: U.S. Census Bureau, Federal Highway Administration Annual Highway Statistics U.S. Department of Transportation, National Highway Traffic Safety Administration. Drunk-driving fatalities represent the total number of fatalities (occupants and nonoccupants) in motor vehicle traffic crashes involving a driver or motorcycle rider with a blood alcohol concentration of .08 or higher. http://www-nrd.nhtsa.dot.gov/Pubs/811363.pdf; http://www.fhwa.dot.gov/policyinformation/statistics/2008/ ; http://www.census.gov/popest/states/NST-ann-est.html