Download
1 / 24
240 likes | 398 Views
Interannual variability in biogenic emissions driven by dynamic vegetation conditions. Daniel Cohan (PI), Adetutu Aghedo, Erin Chavez-Figueroa, and Ben Lash, Rice University Loretta Mickley and Lei Zhu, Harvard University Bryan Duncan, NASA Christine Wiedinmyer and Alex Guenther, NCAR

E N D
Interannualvariability in biogenic emissions driven by dynamic vegetation conditions Daniel Cohan (PI), Adetutu Aghedo, Erin Chavez-Figueroa, and Ben Lash, Rice University Loretta Mickley and Lei Zhu, Harvard University Bryan Duncan, NASA Christine Wiedinmyer and Alex Guenther, NCAR Agency partners: TCEQ and CARB
Motivation and Objective • Biogenic emissions strongly impact air quality and its responsiveness to control measures • Regulatory modeling often uses static, outdated vegetation conditions • Could dynamic vegetation conditions influence air quality decision making? OBJECTIVE: Explore how interannual variability in biogenic emissions is driven by changing meteorology and vegetation conditions
Δ MODIS OMI (& GOME-2) Leaf Area Index (LAI) HCHO Biogenics Model (MEGAN) Δ Δ isoprene
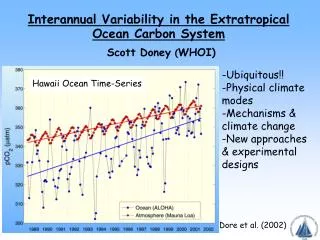
Interannual variability in OMI HCHO 2007 drought Duncan et al., GRL 2009
Influence of ΔLAI on MEGAN BVOC Average July LAI (from 8-day MODIS) Monthly CA-statewide biogenic reactive organic gas (ROG) emissions (essentially BVOC): Meteorology is held constant at 2005 levels and 8-day LAI (MODIS) is allowed to change from year-to-year **** Data is preliminary **** Slide from Jeremy Avise, CARB
ΔLAI and ΔMeteorology drive ΔBVOC Gulden et al., JGR, 2007
Progress to Date • Analysis of interannual variability in MODIS LAI and NARR reanalysis meteorology fields • Processed LAI data obtained from Myneni group (Boston U.) • MEGAN simulations ofΔBVOC due to ΔLAI • Will extend to variability in meteorology • Correlations of isoprene with temperature and rainfall • Correlations of OMI HCHO data with meteorology and EVI vegetation index • Extension to GOME-2 HCHO and to LAI in progress
Biome Types and mean August LAI in MODIS Biome Types used by MODIS for LAI determination (2004) LAI m2 per m2 Data from R. Myneni group, Boston U.
(Std dev/Mean) ≈ 0.1 for MODIS LAI in August over most forested regions
August 2005: Cool, wet, high LAI over Southeast Drought Data from NOAA at http://www.ncdc.noaa.gov/temp-and-precip/drought/historical-palmers.php
June 2007: Dry, hot, low LAI over SE US; Cool, wet, high LAI over Texas Drought Data from NOAA at http://www.ncdc.noaa.gov/temp-and-precip/drought/historical-palmers.php
August 2011: Extreme drought, low LAI over Texas, parts of Southeast Drought Data from NOAA at http://www.ncdc.noaa.gov/temp-and-precip/drought/historical-palmers.php
LAI (MODIS) and Temperature (NARR) anomalies over Southeast US LAI____Temperature_____ 90W to 78W and 32N to 36N (SE US)
Surface isoprene highly correlated with T, but shifts lower in drought year 2008: typical 2007: drought
OMI HCHO Slant Column Density during the growing season For Background correction 1 High HCHO in the SE U.S. 2 Wild fires 3 Some anthropogenic sources: Houston
OMI HCHO Slant Column Density during the winter Drill Rigs & Wells 1 • Human Activity: in circle • High albedo from Snow: High values in the North • However, in Texas, especially Houston, HCHO is very low 1 From Nicole Downey
Temperature drives HCHO levels (1) (1) (2) (3) Three methods for variable selection: all show temperature is driving factor
HCHO and Temperature anomalies HCHO correlated with T in growing season, but not in winter
HCHO densities turn-over at high temperature HCHO: OMI, Daily, 0.5 by 0.5 degreeT: 2m above the ground, GOES-5, Daily, 0.5 by 0.5 degreeThen, HCHO was binned by T in a 3 K step-wise: HCHO Column Density 19 181 285 1543 3965 4037 1575 631 Turn-over ~ 34˚C
HCHO and EVI anomalies in Houston, 2005 - 2008 R2=0.003 When seasonal trends are removed, basically HCHO and EVI are independent from each other.
Short-term Next Steps • Correlations among meteorology, LAI, satellite HCHO, and ground-level isoprene • How to quantify LAI-influencing meteorology, drought? • OMI and GOME-2 HCHO observations jointly? • MEGAN model predictions of BVOC response to Δmeteorology & LAI, separately and jointly • How to generate or obtain multiple summers of MEGAN-ready (WRF?) meteorology data?
Long-term Modeling Plan • Model multiple pathways by which variable vegetation and soil influence air quality • ΔVegetation ΔBVOC (MEGAN) • ΔVegetation ΔDeposition of OVOC & O3(Karl et al., 2010) • ΔFertilizer, rain, etc. ΔSoil NOx(Hudmanet al. scheme) • Extend to HONO emissions (Su et al., Science, 2011) • Compare with satellite and ground observations of HCHO, NO2, and isoprene • Model the influences on ozone and PM and their sensitivities to emissions • Influence of climate change?
Hudman linked ΔSoil NO with ΔOMI NO2; 2x soil NO of previous models Hudman et al., ACP 2010
Karl et al.: Faster than expected vegetative uptake of OVOC; Function of LAI Karl et al., Science, 2010