Download
1 / 1

E N D
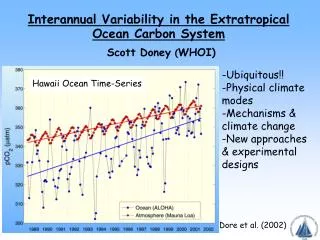
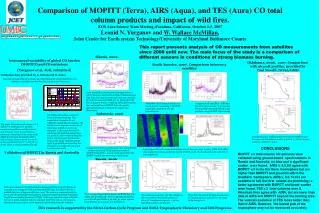
Comparison of MOPITT (Terra), AIRS (Aqua), and TES (Aura) CO total column products and impact of wild fires.EOS Aura Science Team Meeting, Pasadena, California, October 1-5, 2007Leonid N. Yurganov and W. Wallace McMillan, Joint Center for Earth system Technology/University of Maryland Baltimore County This report presents analysis of CO measurements from satellites since 2000 until now. The main focus of the study is a comparison of different sensors in conditions of strong biomass burning. Siberia, 2006 Interannual variability of global CO burden (MOPITT) and CO emissions (Yurganov et al, JGR, submitted) Validation data provided by A. Dzhola and N. Jones Oklahoma, 2006, 2007. Comparison with aircraft profiles, provided by Paul Novelli, NOAA/GMD South America, 2007. Comparison between 3 satellites Emissions are growing after 2000, especially during the second half of the year. Leaders in variability are Northern boreal areas and Indonesia. Daily mean total columns were averaged over the entire Siberia to the East from Urals. Emissions from July fires (between days 180 and 210) were detected by both instruments (AIRS ver. 4). During the first half of the year there is a striking difference between day- and night time MOPITT data: the quality parameters plotted at the bottom explain this discrepancy. Variability of CO column mount over South America according to MOPITT (day time). 2005 level was the highest so far. Comparison of 3 satellites. AIRS data presented here is from v 5 processing. Missing AIRS data from March-June are due to a gap in DISC reprocessing Indonesia, 2006 CO additional burdens over main areas of biomass burning. The magnitudes of maxima do not represent magnitudes of emission: the burden excess depends on the rate of removal as well (how much was removed). A discretion between N. American and Eurasian emissions is not possible; due to rapid mixing they form a common pool of pollutants. Africa is the major emission source (49% of global BB emission) but the emissions are stable with years and anomalies are small. Top panel: CO total mass between 70º S and 70º N. Red line is for monthly means averaged between March 2000 and February 2002 that are taken as reference. Green line in the center is the difference between measured burden and reference. Bottom panel is a result of box-model inversion: P’ = dM’/dt + L’ chem, where L’ chem is removal by OH. Simultaneous CO profiles measured from two satellites and from aircraft. Coincidence is almost perfect (< 50 km in space and a few minutes in time). CONCLUSIONS Emissions from strong Indonesian fires in September – October increased CO abundance; results of MOPITT and AIRS v. 4 are in good agreement. The MOPITT quality parameters are satisfactory. Left picture. CO total column distribution over S. America, Sept. 2, 2007, AIRS. TES nadir data (right plot) correspond to the middle of AIRS swath. Three adjacent orbits are shown for comparison. Validation of MOPITT in Russia and Australia MOPITT v.3 total column CO amounts were validated using ground-based spectrometers in Russia and Australia; no bias and a significant scatter were found. AIRS v. 4.0.9.0 agree with MOPITT v.3 in the Northern hemisphere but are higher than MOPITT and ground truth in the Southern hemisphere. AIRS v. 5.0.14.0 is not available in full, but first results are promising; a better agreement with MOPITT and lower scatter were found. TES v.3 total columns over S. American fires agree with AIRS, but are lower than data of AIRS and MOPITT beyond the burning area. The vertical resolution of TES looks better than that of AIRS. However, the lowest part of the troposphere may not be measured accurately. Russia, 2006 Daily mean values of CO total column in Zvenigorod Russia and Wollongong, Australia were compared with matching MOPITT data. For MOPITT level 3 gridded data for 1x1 degrees cells were used. The scatter is explained partly by errors of both instruments and partly by imperfect matching in time and space. Total Column Quality Parameter (TCQP) is the tropospheric average of Profile Percent A-priori, supplied with the standard MOPITT product. 0% means no information from a-priori, 100% means no information from the radiance. There is a good agreement between MOPITT day-time values and ground truth. Note an agreement between ground truth and AIRS v.4 for July 30, when a plume from Siberian fires passed over Zvenigorod. CO profiles measured by two instruments at the very center of the burning area (see above). Coincidence in space is < 50 km, matching in time is 16 minutes. CO profiles measured by three instruments in a background area just before crossing the burning forest. This research is supported by the NOAA Carbon Cycle Program and NASA Tropospheric Chemistry and EOS Programs.