Download
1 / 14
140 likes | 254 Views
INTERANNUAL VARIABILITY IN SOIL NITRIC OXIDE EMISSIONS OVER THE UNITED STATES AS VIEWED FROM SPACE. Rynda Hudman , Ashley Russell, Luke Valin, Ron Cohen College of Chemistry UC Berkeley OMI NASA Standard Product Version 1.0.5 December 14, 2009 .

E N D
INTERANNUAL VARIABILITY IN SOIL NITRIC OXIDE EMISSIONS OVER THE UNITED STATES AS VIEWED FROM SPACE Rynda Hudman , Ashley Russell, Luke Valin, Ron Cohen College of Chemistry UC Berkeley OMI NASA Standard Product Version 1.0.5 December 14, 2009
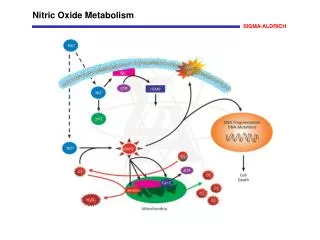
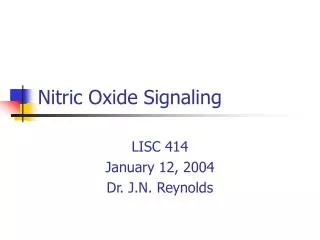
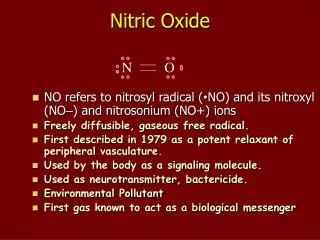
NO & N2O IS A HIGHLY VARIABLE PRODUCT OF MICROBIAL ACTIVITY IN SOILS Processes not well understood, HUGE spatial variability, but best correlation w/ wfps, T, N avail. [See Poster: Placella et al., B13C-0527] [Meixner and Yang, 2006] ATMOSPHERE N2O(g), N2(g), NO(g) BIOSPHERE
LARGE SOIL NOx SOURCE INFERRED FROM SATELLITES GOME Constraints on Natural Soil and Agriculture • GLOBAL: 8.9 Tg N/yr • MIDLATITUDES: 3.9 Tg N/yr • ~22% of global NOx source • ~Midlatitude soil source X2-3 current global model estimates [Jaeglé et al., PNAS, 2005]
OZONE MONITORING INSTRUMENT (OMI) HAS MUCH FINER SCALE RESOLUTION AND DAILY GLOBAL COVERAGE OMI NO2 Column Aug 4, 2004 • 2600 km swath width providing daily global coverage • 1:45 pm equatorial overpass time • 14 x 24 km pixel size at nadir We examine interannual variability in soil NO emissions and our understanding of pulsing behavior over the Agricultural Great Plains
SOIL NOx “EVENTS” pulsing over freshly fertilized Montana fields after rain event ENOx = f( T, biome, w/d) x Pulse (dryspell) x canopy uptake [Yienger and Levy, 1995] ENOx 2005-2007 [Bertram et al., GRL, 2005] We extend this work to include U.S.: daily NARR Temp & Precip MODIS Landtype Fertilizer emissions [Ramankutty]
MONTHLY MEAN MODELED SOIL NOx EMISSIONS Dry, warm conditions anomalously high June 2006 soil emissions Mean Yearly Total: 0.62 Tg N/yr (Fert: 0.12 Tg N/yr)
SOIL EMISSION CONTRIBUTION TO NO2 COLUMN GEOS-Chem global CTM (2x2.5) June 2006 SOIL COLUMN / TOTAL COLUMN SOIL S.D. / COLUMN S.D. SOIL COLUMN = TOTAL COLUMN – NO SOIL COLUMN
OMI NO2 JUNE INTERANNUAL VARIABILITY FOLLOWS SOIL NOx Soil NO model June 2006 OMI June 2006 Anomaly June 2006 had lower than average lightning emissions, suggesting this was not a factor here
OMI NO2 JUNE INTERANNUAL VARIABILITY FOLLOWS SOIL NOx 2005 2006 2007
LARGE PULSING EVENT SEEN IN OMI TIMESERIES OVER RURAL SOUTH DAKOTA We can use OMI to test understanding pulsing triggers Future work: Test using Yan et al., [2005] & soil moisture based scheme developed at Dalhousie Univ. Pulsing event reaches 4x10¹⁵ molec cm2, ~ 2 ppbv assuming 1km well mixed BL
MODELED VARAIBILITY AND PULSING LIKELY UNDERESTIMATED OMI COLUMN NO2 SCALED TO MODEL MEAN MODEL COLUMN NO2 SOIL COLUMN NO2 May June July Column NO2 Using updated retrievals should be able to compute magnitude of emission
MEAN MAXIMUM 8-HR OZONE ENHANCEMENT DUE TO SOIL NOx Mean June maximum 8-hr ozone A lower bound, ozone enhancement due to soil NOx emission doubles from 3 6ppbv
SOIL NOx ENHANCEMENT IMPROVES LOW BIAS & CORRELATION WITH OBSERVED 8-HR MAX OZONE “SUBURBAN” SIOUX FALLS, SD NO2 pulse in OMI Model Model No Soil
CONCLUSIONS • Anomalously dry, warm conditions in June 2006 over the agricultural Great Plains increased observed tropospheric OMI NO2 column by 30% likely due to a ~X2 increase in pulse driven soil NOx emissions. • Daily OMI NO2 columns can be used to refine our understanding of pulsing triggers • Soil NOx emissions are predicted to enhanced mean surface 8-hr max ozone by 6 ppbv, compared with 3 ppbv for 2005 & 2007. • A drier, warmer future climate is predicted over the Great Plains with implications for how efficiently soils retain nitrogen and ozone air quality.