Download
1 / 21
210 likes | 358 Views
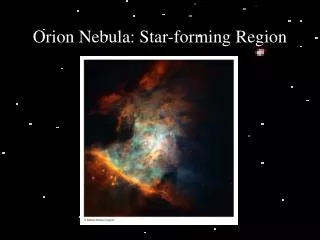
The low-mass IMF in the Orion Nebula Cluster out to 1.5 pc. M. Andersen (RSSD, ESTEC), Michael R. Meyer (ETH, Zurich), M. Robberto, I. N. Reid & L. E. Bergeron. What is the shape of the IMF?. Bastian, Covey & Meyer 2010. Previously. R(0.08-1.0)/(0.03-0.08)=3.3±0.7.

E N D
The low-mass IMF in the Orion Nebula Cluster out to 1.5 pc M. Andersen (RSSD, ESTEC), Michael R. Meyer (ETH, Zurich), M. Robberto, I. N. Reid & L. E. Bergeron
What is the shape of the IMF? Bastian, Covey & Meyer 2010
Previously R(0.08-1.0)/(0.03-0.08)=3.3±0.7 Slesnick et al. 2004, ApJ, 610, 1045
Previously IMF for a sample of nearby embedded clusters ONC Andersen et al. 2008. ApJL, 683, 1083
Ratio for single cluster Andersen et al. 2006. AJ
Previously IMF for a sample of nearby embedded clusters ONC Andersen et al. 2008. ApJL, 683, 1083
Constraints on the enbedded cluster IMF: • Best fit is a Chabrier log-normal, i.e. falling in the BD regime • Stars outnumber BDs (to 0.03Msun) 5 to 1 • However, some open clusters have indicated a lower ratio of stars to BDs • Due to field of view? Low-mass content mass segregated?
IMF derived for σ Ori Lodieu et al. 2009, A&A, 505, 1115
IMF derived for Upper Sco Lodieu et al. 2007, MNRAS, 374, 372
Previously Hillenbrand & Hartmann, 1998, AJ, 492, 540
HST NICMOS III Observations • Parallel NICMOS 3 observations. • F110W (roughly J) and F160W (roughly H) • 102 fields, 2*2 mosaics • Fields spread over 26’*33’ (3.1pc x 3.8pc)
162 square arcminute covered • Integrations time in F110W of 256-1280s • Typically 256-512s • For the F160W obs: 192-762s • FOM used to increase field of view • Vignetting corr. based on previous ONC obs.
Fraction Covered Muench et al, and Slesnick et al. survey radius
Source Detection • F160W band used to identify sources • Radial profiles examined • F110W photometry performed at F160W pos. • PSF slightly variable over time => • 0.5 arcsecond aperture • Sky at 2-3 arcsecond radius • A total of 2054 objects identified
Conversion to 2MASS • Astrometry from ISPI data • ISPI photometry used to reach 2MASS system • Baraffe 98 models. • J,H magnitudes using object templates
Ratio of stars to brown dwarfs R(0.08-1)/(0.03-0.08)=2.4±0.2
What changes? IC 348 Mon R2, Now also Rho Oph ?
Conclusions • We have obtained deep imaging of the ONC in the F110W and F160W filters • Data complete below 20 Mjup outside 0.35pc • We find, after field star subtraction the ratio of stars to brown dwarfs to decrease with radius. • R(0.08-1.0)/R(0.03-0.8)=2.4±0.2