Download
1 / 45
450 likes | 645 Views
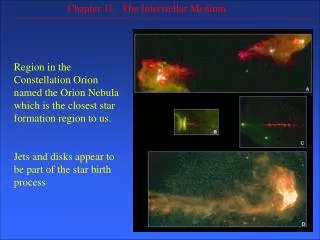
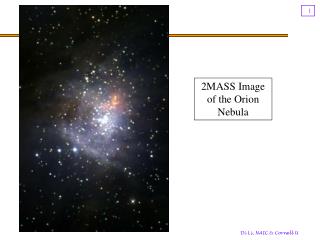
2MASS Image of the Orion Nebula. Massive Cores in Orion. Di Li NAIC, Cornell University February, 2002. HMSF vs. LMSF. Spatial Distinction LMSF region: Taurus GMCs: Orion “Intermediate”: Ophiuchus Higher Star Forming Efficiency for HMSF “Thermal” vs.“Turbulent” Cores

E N D
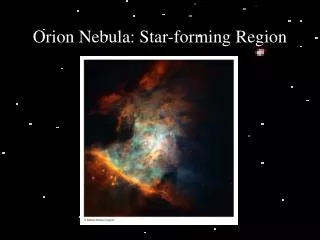
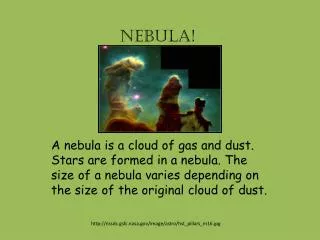
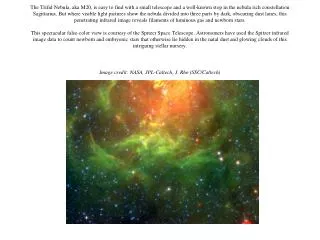
2MASS Image of the Orion Nebula Di Li, NAIC & Cornell U
Massive Cores in Orion Di Li NAIC, Cornell University February, 2002
HMSF vs. LMSF • Spatial Distinction • LMSF region: Taurus • GMCs: Orion • “Intermediate”: Ophiuchus • Higher Star Forming Efficiency for HMSF • “Thermal” vs.“Turbulent” Cores • Initial Conditions? • Super vs. Sub Critical • Evolutionary Paths? • No pre-main-sequence for HMSF? Di Li, NAIC & Cornell U
LMSF: standard model • Four Stages • Core: Virial equilibrium, Ambipolar diffusion • Collapse: Inside-out • Jets: Deuterium Burning, Stellar energetics start to take over • Accretion Disk: the termination of infall will determine the final mass of the new star. • Evidence • Association between low mass cores and Young Stellar Objects (YSOs) • Ammonia cores: 0.05pc, 10K, almost thermal support, sign of infall • outflows and disks around YSOs, such as T Tauri stars Di Li, NAIC & Cornell U
HMSF: Time Scale • Different Time Scales/Paths • Infall time scale: • Kelvin-Helmholtz: 1 M: tKH~107 yr, M>5MtKH <tinf no pre-main-sequence! • Different Initial Conditions • Massive cores could be supercriticalfragmentation?, cluster formation? Binary? Di Li, NAIC & Cornell U
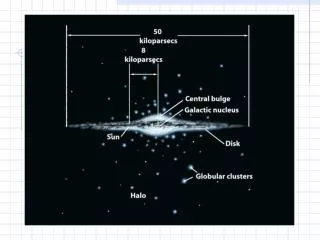
Observational Challenge • Massive young stars are energetic. • In Orion, a large region are dominated by OB clusters, e.g., filamentary morphology. • Massive stars tend to be found in clusters • Massive-Core identification, initial condition, association with HMSF, not clear. • Smaller Population • Greater Distances • Other than Orion, Others identified by remote HII regions, e.g. NGC 3603 at 7 Kpc. • Limited by angular resolution of mm instruments Di Li, NAIC & Cornell U
Project Outline • Identify resolvable by current radio, millimeter and submillimeter instruments: Effelsberg, FCRAO, 12M, and CSO • Multiple tracers to measure initial conditions, T, M, n, accurately • Study energy balance and stability of massive cores • Chemistry and Core Evolution • Comparison with LMSF cores • Future Work and Related Subjects Di Li, NAIC & Cornell U
Quiescent cores chosen from CS 1-0 catalog (Tatematsu et al. 1993) Why Orion: the closest GMC at about 450 pc: 44” ~ 0.1pc High Density Tracer Map Available (not for Ophiuchus!) Why These Cores: Far from BN/KL, at least 30 arcmin away No IR association Reasonable Size Sources Selection Di Li, NAIC & Cornell U
BN/KL Ori2 -Ori15 Orion Molecular Clouds Sakamoto et al. 1994; Lis et al. 1998; Wiseman & Ho 1998 Di Li, NAIC & Cornell U
Choices of Tracers • Column density: C18O 1-0 / 2-1 Well known abundance Less variation compared to rarer species • Temperature: NH3 inversion lines (1,1)/(2,2) no need for absolute calibration especially fit for mid range temperature: 15K-35K • Density: C18O 2-1/1-0 line ratio, CS 5-4/2-1 different critical densities • Possible depletion: continuum & N2H+ 1-0 Di Li, NAIC & Cornell U
Observation: Time and Efforts Di Li, NAIC & Cornell U
Kinetic Temperature • Importance • Determines excitation level, along with density • Affect level population and the derivation of mass • Affect dust temperature through gas dust coupling • important factor in the derivation of dust mass • Sound speed and mass accretion rate: heat up before star forming collapse? • Judging the importance of turbulence • Methods • Thermalized line: CO • Carbon chain molecules • Ammonia (NH3) Inversions Di Li, NAIC & Cornell U
Why Ammonia? • Only Collisionally Coupled • Population Concentrated in Metastable States • Level Structure: at 20K, N(2,1)/N(1,1) ~7.6% • A Coefficients(1,1) : 1.67x10⁻⁷ (2,2) : 2.23x10⁻⁷ (2,1) (1,1): 4.35x10⁻³ • Frequency Proximity Inversions • (1,1) -- 23,694.495 MHz • (2,2) -- 23,722.633 MHz Di Li, NAIC & Cornell U
Derivation of Tk • Optical Depths • (1,1): from hyperfine lines • (2,2): calculated • Rotational Temperature (1,1)/ (2,2) => N(1,1)/N(2,2) • TR -> Tkin : Three level model or more sophisticated excitation models Di Li, NAIC & Cornell U
Temperature Maps Di Li, NAIC & Cornell U
Error Analysis • Error propagation not feasible • hyperfine fitting • ratio of two optical depth • excitation calculations in converting TR to Tk • Monte Carlo Approach • Treat the whole derivation as a black box • Generate noise • Central Limit Theorem Di Li, NAIC & Cornell U
Noise Statistics • 10, 000 runs-> Gaussian distribution for noise • The spread is determined by S/N • 5 sigma: 1.8 K • 10 sigma: 0.9 K Di Li, NAIC & Cornell U
Getting Serious about Coolness • Student’s t Test • Divide data into two sets by the 50% intensity contour: • Center: 31 -> Mean -1.3 K • edge: 54 -> Mean 0.76 K • P(null) = 10-9 Di Li, NAIC & Cornell U
Spatial Correlation: Intensity and Tk • 3D Correlation: no standard statistics • Linear correlation test: Pearson’s r Di Li, NAIC & Cornell U
Spatial Correlation: R & p r ~ -0.6 p(null)~ 0.01 Credible anti-correlation Di Li, NAIC & Cornell U
Column Density • Usual approximation: optically thin and no background • Correction Factors Di Li, NAIC & Cornell U
LVG analysis of Correction Factors Recipe for N(C18O) Di Li, NAIC & Cornell U
Column Density Maps Di Li, NAIC & Cornell U
Finding Cores • Fit by Gaussian • 2D Gaussian • Fit by eye • if the edge not dropping to a really low level Di Li, NAIC & Cornell U
Cores Di Li, NAIC & Cornell U
Virial Equilibrium • The Virial Theorem Steady state: Di Li, NAIC & Cornell U
Kinetic Energy and Gravity: mvir • Virial Mass and Mass Ratio: gravitationally bond? • Axis Ratio: rule out pure oblate models. Assuming prolate cores in our calculations Fall and Frenk 1983 Di Li, NAIC & Cornell U
Stability and Critical Mass • Critical Mass • assume B=100 G • Use 13CO maps for deriving pressure confinement Di Li, NAIC & Cornell U
Core Stability Di Li, NAIC & Cornell U
Core Stability: Another Look Stable on this scale! • Gravitationally bounded • Pressure confinement significant • Sufficient internal turbulent support and stable • Steady magnetic energy density provides insignificant support assuming B~100 G Di Li, NAIC & Cornell U
A coupled problem Localized Approximation: Large Velocity Gradient method (Goldreich & Kwan 1974; Goldsmith, Young, & Langer 1983) Semi-automatic algorithm Self-iterating LVG Inputs: X, n, dv/dr, T, cross-section-, A outputs: TA, Define a confidence indicator: Chi square Minimization of Chi square Downhill simplex method Radiative Transfer Excitation Radiative Transfer: Chi Square approach Di Li, NAIC & Cornell U
Density and Abundance • Solutions for ORI2, typical of cores other than ORI1 Di Li, NAIC & Cornell U
Density and Abundance • Solutions for ORI1 Di Li, NAIC & Cornell U
Behaviors of Antenna Temperatures • Contours of TA on a X-n plane=> • Critical Density • C18O 1-0 ~ 2x103 cm-3 • C18O 2-1 ~ 2x104 cm-3 • CS 2-1 ~ 2x105 cm-3 • CS 5-4 ~ 5x106 cm-3 • Only accurate around turning regions! Di Li, NAIC & Cornell U
What do we learn from CS? • Reasonable fits for ORI1 • Density upper limit for other cores Di Li, NAIC & Cornell U
Density Gradients • Theory • Hydrostatic equilibrium: r-2for infinite isothermal sphere and Bonnor-Ebert spheres • Collapse: r-1.5 Singular isothermal solution by Shu (1977) & Uniform density sphere by Larson (1969); Penston (1969) • Observational Evidence • CS 5-4 is more concentrated • Discrepancy between N/r and n from LVG • Column density profiles=> Di Li, NAIC & Cornell U
Radiative Transfer With Density Structures • Monte Carlo type radiative transfer codes Ratran by Hogerhieijde & van der Tak (2000) Spherical symmetrical code publicly available • Consistent with LVG for a uniform sphere cloud model (test species HCO+) • Elements of the cloud model for ORI1 • Inner core: r~0.05 pc & n~106 cm-3, Bonnor-Ebert sphere • Outer envelope: r~0.5pc & n~ 105 cm-3, n drops as an isothermal sphere • Temperature gradient incorporated (given by observations) Di Li, NAIC & Cornell U
Comparison with ORI1 Data • Density differentiation required in self-consistent cloud models • ORI1 has an inner denser core embedded in the an extended envelope, sign of further evolution than cores south of the Orion Bar Di Li, NAIC & Cornell U
Dust Emission: Promises and Problems • Pro: No chemical abundance variation and mapping at higher resolution • Con: Large uncertainty • Emissivity • Q • Temperature • M(T)dTT-3-/2 Di Li, NAIC & Cornell U
350 Micron Continuum Di Li, NAIC & Cornell U
Gas to Dust Ratio • Using gas temperature TdTk. • Gas-dust coupling • is good for n>2x105 cm-3 (Goldsmith 2001) • Smooth to FCRAO resolution • Derive GDR from N(C18O)/N(dust) • Gradients in GDR! GDR = 30 GDR = 20 GDR = 10 Di Li, NAIC & Cornell U
Depletion • Standard GDR~100 Knapp & Kerr 1974; Scoville & Solomon 1975, and etc. • Existing evidence of depletion • CO isotopes: Gibb & Little 1998 • CS: Ohashi 1999 • Continuum and NH3: Willacy, Langer & Velusamy 1998 depletion factor ranges from 3 to 20 • Evidence for ORI1 • Smaller CS abundance • Correlation between C18O, 350 m, NH3 and N2H+ Di Li, NAIC & Cornell U
Depletion (cont.) • Accretion time scale • ~ [109/n(H2)] yr (Goldsmith 2001) • Chemical models predict a central hole for carbon bonded molecules at certain ages. Nitrogen bonded molecules have much longer depletion time scales. • N2H+ depletes even later than NH3 (Aikawa et al. 2001). • We obtain lower limits for the depletion factor of C18O • ORI1: 10 • ORI2: 5 • The depletion gradients restrain the cloud chemical age to be within 105 to 106 yr Di Li, NAIC & Cornell U
Summary • A rare comprehensive millimeter and submillimeter data set of massive quiescent cores. • Out of 15 selected targets, 7 well defined cores are identified: • Mean mass 230 M • Mean density: 5x104 cm-3 • Elongated cores: mean size ~ 0.3 pc and mean axis ratio ~ 0.6. Not purely oblate. • Gravitationally bond and Stable, with both pressure confinement and internal turbulence playing significant roles • Cooler than environment. Statistically significant temperature gradients with temperature dropping toward cloud centers. • Evidence for depletion of CO and CS with depletion factor > 10 • Evidence for density gradients in ORI1 Not supercritical and no imminent collapse, at 0.1 pc spatial scale. Di Li, NAIC & Cornell U
Ongoing and Future Work • Higher resolution mapping of ORI1 and other cores e.g. SHARC II; APEX; SMA • Comparative study of cores in Ophiuchus • Measuring magnetic field using HI narrow line absorption. Di Li, NAIC & Cornell U