Download
1 / 22
220 likes | 326 Views
Explore mass accretion rates in young stars using Hα measurements in Orion Nebula Cluster, shedding light on star formation processes. Analyze spectroscopic and photometric data to determine accretion rates and evolutionary tracks of low-mass stars.

E N D
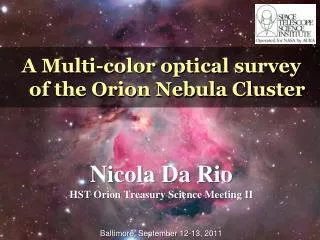
HST survey of the Orion Nebula Cluster Team Meeting – 12-13 September 2011 Mass Accretion Rates from Hα measurements Nino Panagia STScI INAF/CT Supernova Ltd Mass Accretion Rates from Ha Measurements Nino Panagia
Main Characters in this study Nino Panagia (STScI) Nicola Da Rio (ESA) Guido De Marchi (ESA) Massimo Robberto (STScI) Martino Romaniello (ESO) Mass Accretion Rates from Ha Measurements Nino Panagia
Phases of star formation Class 0 Factors-of-ten Timeline Class I Class II - III
PMS stars: How to find them? Low-mass stars grow in mass over time through accretion of matter from a circumstellar disc (e.g. Lynden-Bell & Pringle 1974; Bertout 1989) Typical signature: UV, IR and Hα excess emission How to measure it? 1- Spectroscopy 2- Photometry (e.g. De Marchi, Panagia & Romaniello 2010)
• Free fall equation gives mass accretion rate M Stars physical parameters H luminosity LH gives accretion luminosity Lacc via relationship calibrated using spectroscopic data (e.g.Dahm 2008) Log (Lacc) = Log (LH) + 1.72 Mass M radius R and age t from PMS isochrones in the HR diagram We can study how star formation has proceeded in space and time Mass Accretion Rates from Ha Measurements Nino Panagia
Orion Nebula Cluster – HR Diagram Da Rio et al 2010 WFI data Mass Accretion Rates from Ha Measurements Nino Panagia
Orion Nebula Cluster – HR Diagram Da Rio et al 2010 WFI data Mass Accretion Rates from Ha Measurements Nino Panagia
Hα Luminosity vs dist(θ1 Ori C) Data from Da Rio et al 2009 405 stars with W(Hα)>30A out a sample of1040 with Hα detection Mass Accretion Rates from Ha Measurements Nino Panagia
Mass accretion rates vs dist(θ1 Ori C) Contaminated by fluorescence? Mass Accretion Rates from Ha Measurements Nino Panagia
Mass accretion rates vs dist(θ1 Ori C) Decreasing accretion rate with distance: did stars form in different condtions? Fluorescence free Mass Accretion Rates from Ha Measurements Nino Panagia
Mass accretion rates vs age median values M(accr) 5x10⁻⁸ M/yr Age 2Myr Slope t -1 Mass Accretion Rates from Ha Measurements Nino Panagia
Accreted mass fraction . .. f = (M age)/M* Evolutionary tracks to be revised somewhat (but not drastically) Mass Accretion Rates from Ha Measurements Nino Panagia
Inclined Disks about 1/16 starlight for a face on disk scattered light direct star light Mass Accretion Rates from Ha Measurements Nino Panagia
Inclined Disks Effects 1 Myr population • Face on • i 81o • X i 87o De Marchi, Panagia,& Guarcello 2011, based on Robitaille et al 2006 models Mass Accretion Rates from Ha Measurements Nino Panagia
Comparison with Magellanic Clouds Mass Accretion Rates from Ha Measurements Nino Panagia
Accretion rate and metallicity SMC LMC MW MW−4.70 ± 0.08 NGC 346−4.02 ± 0.02 30 Dor−4.23 ± 0.02 ~ Z ~ 0.4 Z ~ 0.2 Z Mass Accretion Rates from Ha Measurements Nino Panagia
Photo-evaporation of PMS discs De Marchi, Panagia & Romaniello 2010 L(H) > 20 x 10-3 L L(H) = 8 - 20 x 10-3 L SN 1987A L(H) < 8 x 10⁻³ L 100” 50” 0” –50”–100” –100” –50” 0” 50” 100”
Photo-evaporation of PMS discs De Marchi et al. 2011b 30 Dor
Conclusions • Hα excess from about 40% PMS stars • At least 15% PMS stars are virtually uncontaminated by fluorescence • Mass accretion rates about 510-8 M/yr at ~ 2Myr Mass Accretion Rates from Ha Measurements Nino Panagia
COROLLARIES • Accretion more active than suspected may affect the mass function in SF regions • PMS evolutionary tracks including slowly declining accretion are necessary • Substantial low mass star formation may go unnoticed in distant galaxies Mass Accretion Rates from Ha Measurements Nino Panagia
www.starformation.eu Mass Accretion Rates from Ha Measurements Nino Panagia
Mass Accretion Rates from Ha Measurements Nino Panagia