Download
1 / 19
200 likes | 216 Views
Learn how DRMP utilizes ATSPMs to empower cities like Escambia County in making data-driven decisions for efficient traffic signal performance. Discover the benefits and methodology of implementing Active Arterial Management for improved mobility and sustainability.

E N D
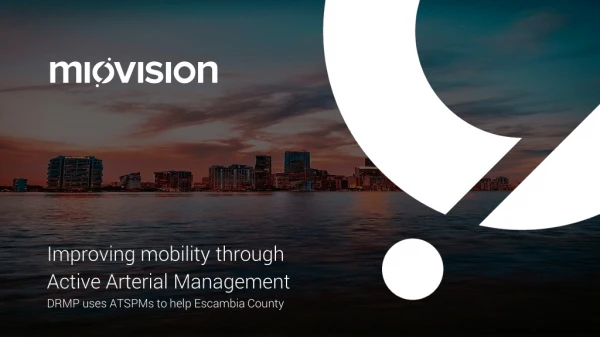
Improving mobility through Active Arterial Management DRMP uses ATSPMs to help Escambia County
Where do ATSPM data come from? Automated Traffic Signal Performance Measures ~100% Sample Size ~100% Sample Size ~16% Sample Size
HealthySignalized Intersections and Corridors • Achieving the objectives requires evaluating the performance at the following 3 levels: • Maintenance • Operations • Optimization • Not only important to achieve healthy intersections but to make sure that it remains that way with the passage of time
Miovision TrafficLink makes getting ATSPM data easy TrafficLink portal SmartLink
Escambia County ATMS • 190 Total Traffic Signals • 18 Signal ATMS Pilot Project • Current ATMS System • 90 Total Connected Signals • 44 Miovision TrafficLink Devices
N. Palafox St. Signal Retiming Hood Dr • 16 Total Signalized Intersections • 105,000 vehicles per week • Parallel to Major Roadway Reconstruction Project • School zones Ensley St Detroit Ave Olive Rd Burgess Rd Hancock Ln
ATSPMs • Overall Corridor Performance • Corridor Congestion Scan • Time Space Diagrams • Purdue Coordination Diagrams • Individual Intersection Performance • Split Trends • Delay
Conclusion • Time Savings: 1,200 vehicle hours per week • Fuel Emissions Reduction: 3,400 gallons per week • Cost Savings: $7.8 Million of Cumulative Delay and Fuel Savings • Benefit/Cost Ratio 81:1
Clear Signals eBook • Well structured • Maintenance • Operations • Optimization • Easy to understand • Non academic tone • Very visual • More than 80 figures in total • Example centric • More than 20 practical examples • Miovision functionality focused
Put Active Arterial Management to work for you! http://atspms.com Contact Miovision Contact your local Traffic Engineering Firm Download the Clear Signals ebook
Visit: atspms.com Samuel Campbell, PE, PTOE Project Engineer SCampbell@drmp.com Scott Dolson Account Executive sdolson@miovision.com