Download
1 / 12
120 likes | 137 Views
An update on the zooplankton sampling conducted in the Sentinel Lakes in 2008, including sample collection, processing, and data analysis. Key findings and potential indices are discussed.

E N D
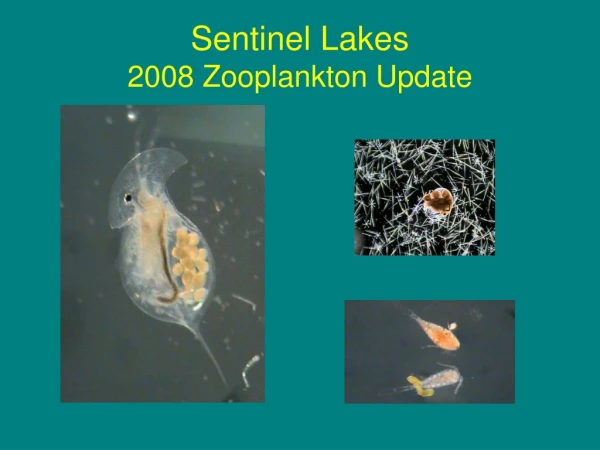
Field Sampling • MPCA staff collected 363 zooplankton samples. • All 24 lakes were sampled monthly from April/May thru October. • At least two vertical tows were taken from each lake at deepest location. • What worked well: Samples delivered to lab periodically throughout season, preserved and labeled well. • Improvements for next year: Better system for ordering supplies, removable bottle labels.
Sample Processing • April thru August samples completed. • Data includes: densities, biomass, percent composition by number and weight, mean length, mean weight, and counts for each taxonomic group. • What worked well: ZCOUNT so far……. • Improvements for next year: new zooplankton counting system?? (we’re working on it).
Data Analysis(April-August only) • Grouped lakes by eco-region and plotted monthly densities and biomass. • In general, the western corn belt/ plains lakes had the highest densities and biomass, while the border lakes had the lowest. • Some overlap between eco-regions.
Mean Zooplankton Densities and Biomass Western Corn Belt-Plains
Mean Zooplankton Densities and Biomass North Central Hardwood Forest
Mean Zooplankton Densities and Biomass Northern Lakes and Forests
Mean Zooplankton Densities and Biomass Border Lakes
Potential Indices • Mean Annual Densities (#/L) • Range 1.46-124.48 TP↑ Density↑ • Mean Annual Biomass (µg/L) • Range 5.87-1169.26 TP↑ Biomass↑ • Total # Taxa • Range 8-18 TP↑ Total #Taxa ↓ • Cladoceran Mean Length (mm) • Range 0.40-1.27 TP↑ mean length↓ • Ratio Calanoids/Cladocerans • Range 0.02-3.59 TP↑ Ratio↓
Individual Species and Assemblages • 37 different taxa in 24 lakes • 10 taxa were common in most lakes (ubiquitous species) • Three species of calanoids and one daphnia species appeared to be present in the deeper oligotrophic or mesotrophic lakes only. • Two calanoid species appeared to be present only in shallow eutrophic lakes. • Planning to analyze data using PC-Ord