Populations and Energy Flow in Ecosystems
340 likes | 359 Views
This chapter explores the properties of populations and the flow of energy in ecosystems. It covers topics such as population size, density, dispersion, growth rate, age structure, survivorship, and the conversion of light energy to chemical energy through photosynthesis. The chapter also discusses the cycling of materials in biogeochemical processes and the different patterns of population dispersion and mortality.

Populations and Energy Flow in Ecosystems
E N D
Presentation Transcript
Chapter 19Populations 03.07.08 / 03.10.08
Energy Production • The conversion of light energy to chemical energy is called “gross primary production.” (photosynthesis) • Plants use the energy captured in photosynthesis for maintenance and growth. • The energy that is accumulated in plant biomass is called “net primary production.”
Video • Energy in a coral reef ecosystem • Using a coral reef as an example, this video will show how energy flows through producers and consumers in an ecosystem
Biogeochemical Process • Cycling of materials between the environment and organisms • Examples • Water cycle • Nitrogen cycle • Phosphorus cycle • Carbon cycle
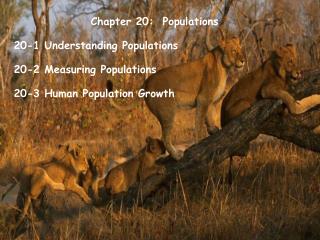
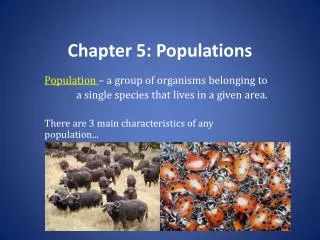
Section 1 Understanding Populations Properties of Populations • A population is a group of organisms that belong to the same species (i.e., can successfully interbreed) and live in a particular place at the same time. • Populations can be measured in terms of size, density, dispersion, growth rate, age structure, and survivorship.
Section 1 Understanding Populations Properties of Populations • Population Size • A population’s size is the number of individuals the population contains. • US population is 303,581,773 as of 8:15am, March 7, 2008 and 303,602,476 at 8:14am, March 10th • Population Density • Density is a measure of how crowded the population is. • The US is 9,826,630 km2 • US density is almost 31 people per km2 • Japan’s density is 330, England is 240, Mexico is 50 • Polk County has 116 people per km2 • Manhattan has 29,706 per km2
Section 1 Understanding Populations Properties of Populations • Dispersion • Dispersion describes the distribution of individuals within the population and may be random, uniform, or clumped.
Section 1 Understanding Populations Three Patterns of Population Dispersion
Section 1 Understanding Populations Three Patterns of Population Dispersion • Minnows disperse in clumps • Hawks disperse evenly • Dandelions disperse randomly
Section 1 Understanding Populations Population Dynamics • A population’s age structure indicates the percentage of individuals at each age. • A population’s survivorship shows patterns of mortality • Populations show three patterns of mortality or survivorship curves
Section 1 Understanding Populations Survivorship Curves • Type I (low mortality until late in life) • Type II (constant mortality throughout life) • Type III (high mortality early in life followed by low mortality for the remaining life span).
Section 2 Measuring Populations Population Growth Rate • Demographers, scientists who study population dynamics, define the growth rate of a population as the amount by which a population’s size changes in a given time. • Population Size • Birth rate - death rate = growth rate
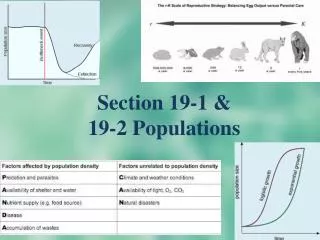
Section 2 Measuring Populations The Exponential Model • The exponential model describes perpetual growth at a steady rate in a population. • The model assumes constant birth and death rates and no immigration or emigration.
Section 2 Measuring Populations The Logistic Model • In the logistic model, birth rates fall and death rates climb as the population grows. • When the carrying capacity is reached, the number of individuals the environment can support is reached and population growth becomes stable.
Section 2 Measuring Populations Two Population Growth Models
Population Evolution • Wilson and MacArthur developed the r/K selection theory • r- Selected (max growth rate, below carrying capacity) • Early reproduction • Short life span • High mortality rate • Little or no parental care • Large investment in producing large numbers of offspring • Below carrying capacity • Examples: • bony fish and grasshoppers • K-Selected (maximizes population size near K) • Late reproduction • Long life span • Low mortality rate • Extensive parental care • Greater parenting investment offspring • At or near carrying capacity • Examples: • sharks and elephants
Limiting Factors • Populations require a variety of resources, such as food, water, space, sunlight, oxygen, etc • A limiting factor controls some aspect of a population, such as size or birth-rate; population cannot exceed the limit of a necessary resource • Law of the Minimum – population growth will be limited by the required factor that is in shortest supply. • If there is enough grass in a prairie to support 1000 zebras, but only enough water to support 500 zebras, there will be no more than 500 zebras.
Section 2 Measuring Populations Population Regulation • Population-limiting factors, such as competition, are density-dependent because the effect on each individual depends on the number of other individuals present in the same area. • Population-limiting factors, such as bad weather and fires, are density-independent because the effect on each individual does not depend on the number of other individuals present in the same area.
Population Regulation • Density Dependent Limits • Food • Water • Shelter • Disease • Density Independent Limits • Weather • Climate
Section 2 Measuring Populations Population Regulation • Population Fluctuations • All populations fluctuate in size. • Perils of Small Populations • Small populations have low genetic diversity and are subject to inbreeding, so they are less likely to adapt to environmental changes.
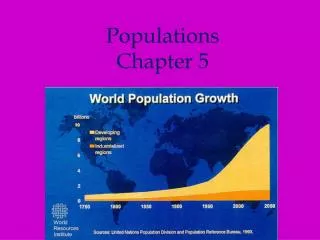
Section 3 Human Population Growth History of Human Population Growth • The Development of Agriculture • About 10,000 to 12,000 years ago, the development of agriculture increased the growth rate of the human population. • The Population Explosion • Around 1650, improvements in hygiene, diet, and economic conditions further accelerated population growth. • After World War II, the human population grew at the fastest rate in history, largely because of better sanitation and medical care in poorer countries.
Section 3 Human Population Growth History of Human Population Growth
Human Population Dispersion • Population density by nation
Section 3 Human Population Growth History of Human Population Growth • Population Growth Today • Today, developing countries have faster human population growth and lower standards of living than developed countries do. • Human populations have undergone rapid growth, yet in some developed countries, populations have stopped growing.
Section 3 Human Population Growth Demographic Transition • The demographic transition model shows how these population changes happen.
Societal Transitions • Industrial societies are marked by: • Use of natural energy resources (e.g. fossil fuels) to increase productivity • Move from agrarian based-economy to manufacturing • Postindustrial societies are marked by: • Move from production (steel) to services (finance), and healthcare, education, research and government dominate economy • Social emphasis moves from blue-collar workers to scientists and technical workers
Video • Coral Man • What is Ken Nedimyer’s profession? • What is the reason for numbering each stand on his artificial reefs?
Let’s Review • Choose an example of a species for each of the three types of dispersion. Explain what evidence you can use for each species to justify it as an example. • Do you think house cats are an example of r-selection or K-selection? Explain. • What unknown factors might make it difficult to predict the human population of nation 100 years from now?