Download
1 / 10
100 likes | 114 Views
Explore survival rates & hazard functions over 8 years by age band in UK's renal replacement therapy patient data, highlighting adjusted and comorbidity-based 1-year survival rates.

E N D
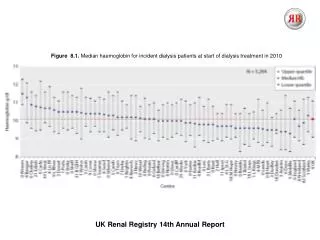
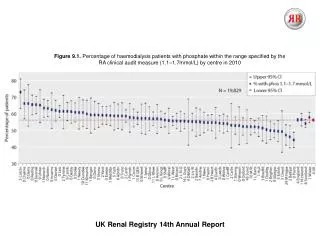
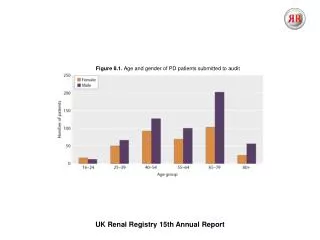
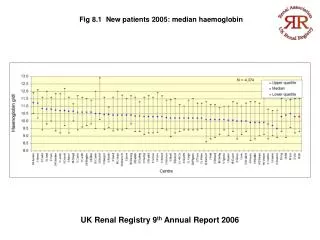
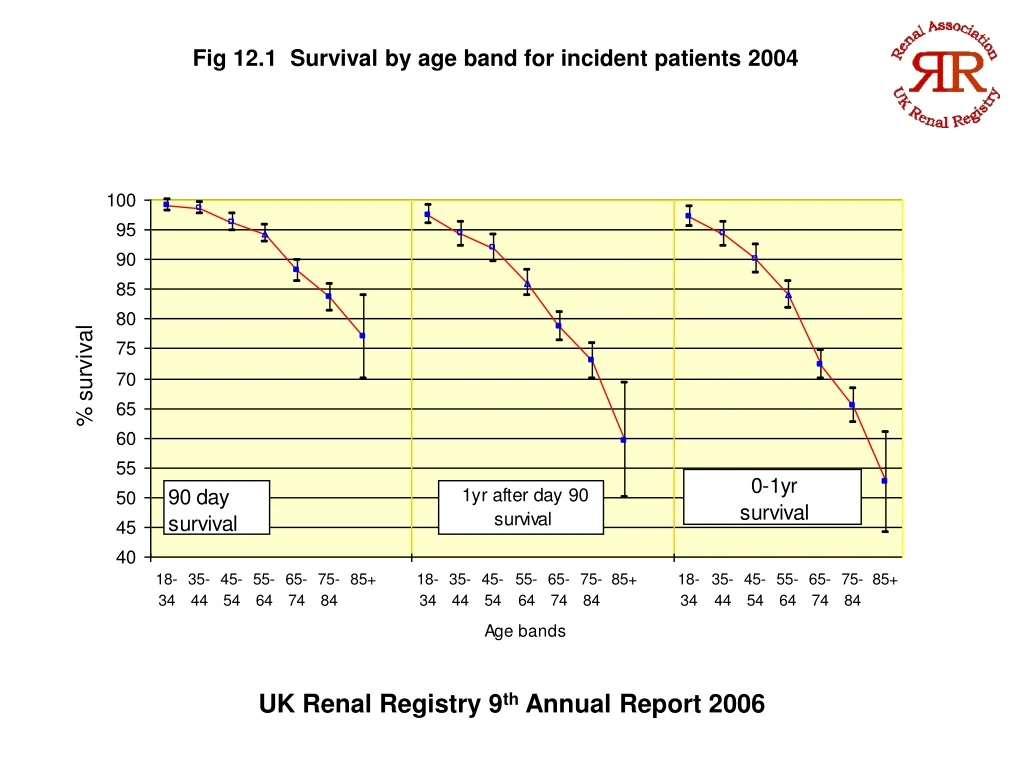
Fig 12.1 Survival by age band for incident patients 2004 UK Renal Registry 9th Annual Report 2006
Fig 12.2 KM Survival on renal replacement therapy over 8 years by age group UK Renal Registry 9th Annual Report 2006
Fig 12.3 Hazard functions by age from start RRT to 1st year (probability of dying in the following month) UK Renal Registry 9th Annual Report 2006
Fig 12.4 6m Hazard of death v Time on RRT by age group (Transplants included) UK Renal Registry 9th Annual Report 2006
Fig 12.5 6m hazard of death v Time on RRT by age group; non-diabetics (transplants included) UK Renal Registry 9th Annual Report 2006
Fig 12.6 6 m Hazard of death v Time on RRT by age group; diabetics (transplants included) UK Renal Registry 9th Annual Report 2006
Fig 12.7 Adjusted 1 year after 90 day Survival (age 60): 1999 sites only and all RR sites UK Renal Registry 9th Annual Report 2006
Fig 12.8 Adjusted survival in the first 1yr after 90 days : 2004 cohort adjusted to age 60 years, not censored for transplants UK Renal Registry 9th Annual Report 2006
Fig 12.9 Funnel plot of age adjusted survival for 1 year after 90 days (2001 - 2004, 4 year cohort) UK Renal Registry 9th Annual Report 2006
Fig 12.10 Adjusted 1 year after 90 day survival for centres with more than 85% returned comorbidity data UK Renal Registry 9th Annual Report 2006