Download
1 / 43
430 likes | 532 Views
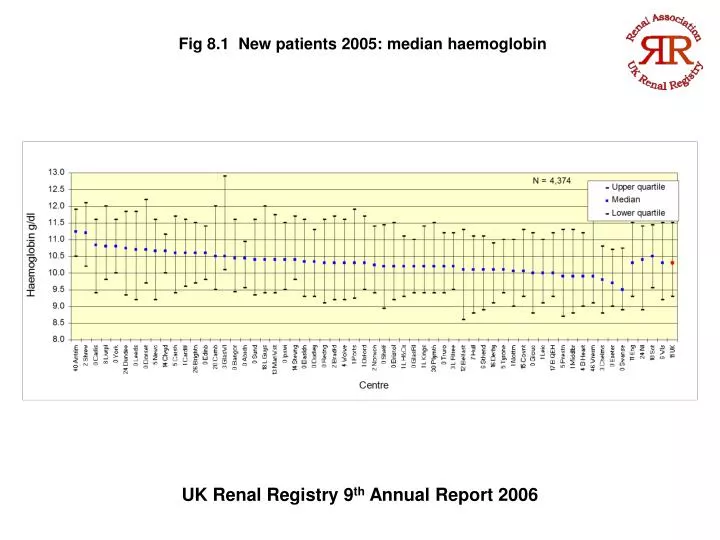
Fig 8.1 New patients 2005: median haemoglobin. UK Renal Registry 9 th Annual Report 2006. Fig 8.2 New patients 2005: percentage Hb >= 10 g/dl. UK Renal Registry 9 th Annual Report 2006. Fig 8.3 Haemoglobin distribution: new patients. UK Renal Registry 9 th Annual Report 2006.

E N D
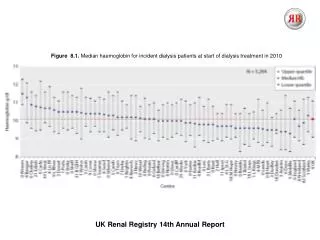
Fig 8.1 New patients 2005: median haemoglobin UK Renal Registry 9th Annual Report 2006
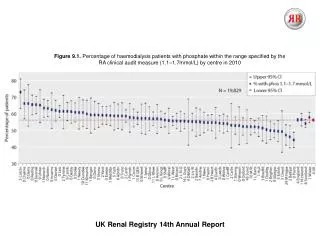
Fig 8.2 New patients 2005: percentage Hb >= 10 g/dl UK Renal Registry 9th Annual Report 2006
Fig 8.3 Haemoglobin distribution: new patients UK Renal Registry 9th Annual Report 2006
Fig 8.4 Serial median haemoglobin for new patients in 2005 UK Renal Registry 9th Annual Report 2006
Fig 8.5 Serial percentage of new patients in 2005 with haemoglobin >= 10 g/dl UK Renal Registry 9th Annual Report 2006
Fig 8.6 Median haemoglobin : HD UK Renal Registry 9th Annual Report 2006
Fig 8.7 Percentage of HD patients with Hb > 10 g/dl UK Renal Registry 9th Annual Report 2006
Fig 8.8 Percentage of HD patients with Hb > 11 g/dl UK Renal Registry 9th Annual Report 2006
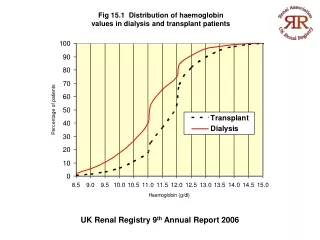
Fig 8.9 Distribution of haemoglobin in patients on HD UK Renal Registry 9th Annual Report 2006
Fig 8.10 Percentage of HD patients with Hb 10.5-12.5g/dl UK Renal Registry 9th Annual Report 2006
Fig 8.11 Funnel plot of percentage achieving Hb>10g/dl: HD UK Renal Registry 9th Annual Report 2006
Fig 8.12 Median haemoglobin : PD UK Renal Registry 9th Annual Report 2006
Fig 8.13 Percentage of PD patients with Hb > 10 g/dl UK Renal Registry 9th Annual Report 2006
Fig 8.14 Percentage of PD patients with Hb > 11 g/dl UK Renal Registry 9th Annual Report 2006
Fig 8.15 Percentage of PD patients with Hb 10.5-12.5g/dl UK Renal Registry 9th Annual Report 2006
Fig 8.16 Distribution of haemoglobin in patients on PD UK Renal Registry 9th Annual Report 2006
Fig 8.17 Funnel plot of percentage of patients with Hb> 10g/dl: PD UK Renal Registry 9th Annual Report 2006
Fig 8.18 Percentage of new and prevalent patients with Hb > 10g/dl UK Renal Registry 9th Annual Report 2006
Fig 8.19 Percentage of patients with Hb > 10 g/dl plotted against median Hb: HD UK Renal Registry 9th Annual Report 2006
Fig 8.20 Percentage of patients with Hb > 11 g/dl plotted against median Hb: HD UK Renal Registry 9th Annual Report 2006
Fig 8.21 Percentage of patients with Hb > 10 g/dl plotted against median Hb: PD UK Renal Registry 9th Annual Report 2006
Fig 8.22 Percentage of patients with Hb > 11b/bl plotted against median Hb: PD UK Renal Registry 9th Annual Report 2006
Fig 8.23 Haemoglobin > 10 g/dl 1997 - 2005 UK UK Renal Registry 9th Annual Report 2006
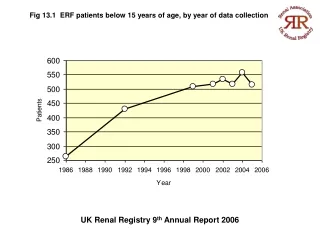
Fig 8.24 Haemoglobin > 10 g/dl new patients 1998 - 2005 UK UK Renal Registry 9th Annual Report 2006
Fig 8.25 Median haemoglobin by time on RRT HD UK Renal Registry 9th Annual Report 2006
Fig 8.26 Median haemoglobin by time on RRT PD UK Renal Registry 9th Annual Report 2006
Fig 8.27 Median serum ferritin : HD UK Renal Registry 9th Annual Report 2006
Fig 8.28 Median serum ferritin : PD UK Renal Registry 9th Annual Report 2006
Fig 8.29 Percentage ferritin > 100 ug/L : HD UK Renal Registry 9th Annual Report 2006
Fig 8.30 Percentage of HD patients with ferritin > 200 ug/L UK Renal Registry 9th Annual Report 2006
Fig 8.31 Percentage of PD patients with ferritin > 100 ug/L UK Renal Registry 9th Annual Report 2006
Fig 8.32 Percentage of PD patients with ferritin > 200 ug/L UK Renal Registry 9th Annual Report 2006
Fig 8.33 Serum ferritin > 100 ug/L 1999 - 2005 UK UK Renal Registry 9th Annual Report 2006
Fig 8.34 Median serum ferritin 1999 - 2005 England and Wales UK Renal Registry 9th Annual Report 2006
Fig 8.35 Median serum ferritin and time on RRT: HD UK Renal Registry 9th Annual Report 2006
Fig 8.36 Median serum ferritin and time on RRT: PD UK Renal Registry 9th Annual Report 2006
Fig 8.37 Percentage of patients with Hb > 10g/dl not on ESA, by age and treatment modality UK Renal Registry 9th Annual Report 2006
Fig 8.38 Percentage of dialysis patients on EPO by age and modality UK Renal Registry 9th Annual Report 2006
Fig 8.39 EPO use in patients with Hb < 10g/dl by age and treatment modality UK Renal Registry 9th Annual Report 2006
Fig 8.40 Percentage of HD patients on EPO by gender and age UK Renal Registry 9th Annual Report 2006
Fig 8.41 Percentage of PD patients on EPO by gender and age UK Renal Registry 9th Annual Report 2006
Fig 8.42 Median Hb vs Mean ESA dose:HD UK Renal Registry 9th Annual Report 2006
Fig 8.43 Compliance with EBPG vs mean ESA dose: HD UK Renal Registry 9th Annual Report 2006