Download
1 / 18
180 likes | 198 Views
Explore percentage of patients meeting clinical audit measures in hemodialysis and peritoneal dialysis. Includes phosphates, calcium, PTH levels, and more. Data presented in funnel plots and longitudinal changes.

E N D
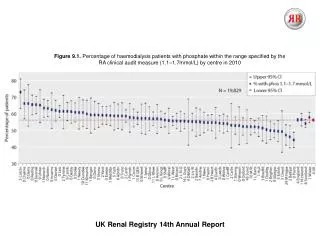
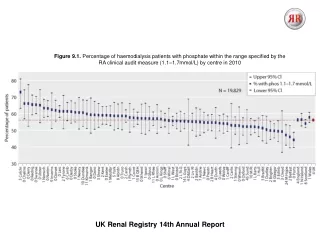
Figure 9.1. Percentage of haemodialysis patients with phosphate within the range specified by the RA clinical audit measure (1.1–1.7mmol/L) by centre in 2010 UK Renal Registry 14th Annual Report
Figure 9.2. Funnel plot of percentage of haemodialysis patients with phosphate within the range specified by the RA clinical audit measure (1.1–1.7mmol/L) by centre in 2010 UK Renal Registry 14th Annual Report
Figure 9.3. Percentage of peritoneal dialysis patients with phosphate within the range specified by the RA clinical audit measure (1.1–1.8 mmol/L) by centre in 2010 UK Renal Registry 14th Annual Report
Figure 9.4. Funnel plot of percentage of peritoneal dialysis patients with phosphate within the range specified by the RA clinical audit measure (1.1–1.8 mmol/L) by centre in 2010 UK Renal Registry 14th Annual Report
Figure 9.5. Longitudinal change in percentage of patients with phosphate below, within and above the 2010 RA standards by dialysis modality 2000–2010 UK Renal Registry 14th Annual Report
Figure 9.6. Percentage of haemodialysis patients with adjusted calcium within range (2.2–2.5 mmol/L) by centre in 2010 UK Renal Registry 14th Annual Report
Figure 9.7. Funnel plot of percentage of haemodialysis patients with adjusted calcium within range (2.2–2.5 mmol/L) by centre in 2010 UK Renal Registry 14th Annual Report
Figure 9.8. Percentage of peritoneal dialysis patients with adjusted calcium within range (2.2–2.5 mmol/L) by centre in 2010 UK Renal Registry 14th Annual Report
Figure 9.9. Funnel plot of percentage of peritoneal dialysis patients with adjusted calcium within range (2.2–2.5 mmol/L) by centre in 2010 UK Renal Registry 14th Annual Report
Figure 9.10. Longitudinal change in percentage of patients with adjusted calcium <2.2 mmol/L, 2.2–2.5 mmol/L and >2.5 mmol/L by dialysis modality 2000–2010 UK Renal Registry 14th Annual Report
Figure 9.11. Percentage of haemodialysis patients with PTH within range (16–32 pmol/L) by centre in 2010 UK Renal Registry 14th Annual Report
Figure 9.12. Funnel plot of percentage of haemodialysis patients with PTH within range (16–32 pmol/L) by centre in 2010 UK Renal Registry 14th Annual Report
Figure 9.13. Percentage of peritoneal dialysis patients with PTH within range (16–32 pmol/L) by centre in 2010 UK Renal Registry 14th Annual Report
Figure 9.14. Funnel plot of percentage of peritoneal dialysis patients with PTH within range (16–32 pmol/L) by centre in 2010 UK Renal Registry 14th Annual Report
Figure 9.15. Funnel plot for percentage of haemodialysis patients within the range for bicarbonate (18–24 mmol/L) by centre in 2010 UK Renal Registry 14th Annual Report
Figure 9.16. Funnel plot for percentage of peritoneal dialysis patients within the range for bicarbonate (22–30 mmol/L) by centre in 2010 UK Renal Registry 14th Annual Report
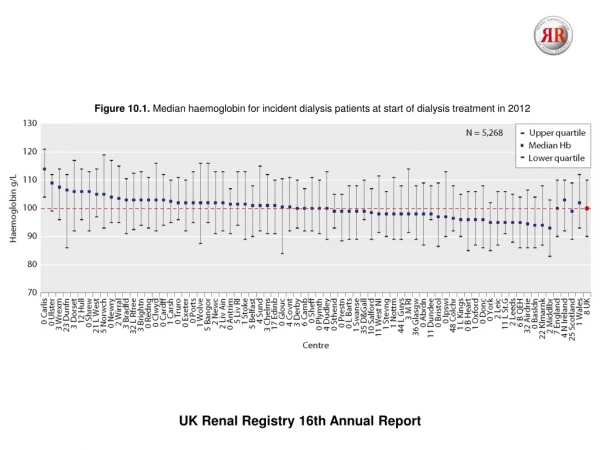
Figure 9.17. Median total cholesterol in haemodialysis patients by centre in 2010 UK Renal Registry 14th Annual Report
Figure 9.18. Median total cholesterol in peritoneal dialysis patients by centre in 2010 UK Renal Registry 14th Annual Report