Solving the Concave Cost Supply Scheduling Problem
280 likes | 372 Views
Explore mathematical formulations and practical solutions for supply scheduling problems with concave cost functions, presented at EURO XXI in Iceland. Discuss cases, solution procedures, and computational results for optimal scheduling.

Solving the Concave Cost Supply Scheduling Problem
E N D
Presentation Transcript
Solving the Concave Cost Supply Scheduling Problem Xia Wang, Univ. of Maryland Bruce Golden, Univ. of Maryland Edward Wasil, American Univ. Presented at EURO XXI Iceland, July 2006
Outline of Lecture • Introduce the supply scheduling problem • Discuss the two cases from the literature • Formulate the problem mathematically • Present and illustrate solution procedures • Computational results • Future work
Problem Statement: Case One • Based on work by Chauhan &Proth, EJOR, 2003 and Chauhan et al., ORL, 2005 • There are n providers and one manufacturing unit • The manufacturing unit has a demand of D • The capacity of provider i is Mi • If there is positive flow xi from provider i to the manufacturing unit, then • The mathematical formulation is given next
Case One Formulation • Short-hand formulation • The cost function where and is concave, continuouslydifferentiable, and increasing
Problem Statement: Case Two • There are n providers and m manufacturing units • Manufacturing unit j has a demand of Dj • The capacity of provider i is Mi • If there is positive flow xij from provider i to manufacturing unit j, then • The mathematical formulation is given next
Case Two Formulation • Short-hand formulation • The cost function where and is concave, continuously differentiable, and increasing
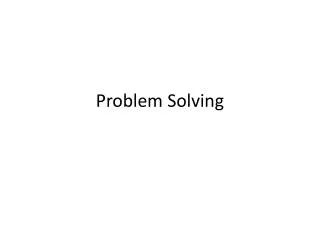
Solution Procedure Overview U1 P1 U2 P2 Greedy/LP U3 GA P3 U4 U1 U1 15 Figure 1 P1 Figure 2 P1 10 U2 U2 20 P2 P2 25 15 U3 U3 P3 P3 U4 U4 Figure 3
Case One Genetic Algorithm (GA1) • Initialization • Randomly generate a binary matrix where POP is the population size in GA1 • We used POP = 50 • Each row is a chromosome
GA1 Continued • Feasibility check • Phase 1. Select the providers • Crossover using Queen-Bee Selection (two-point crossover) • Mutation (one flip per chromosome) • Feasibility check For each chromosome (e.g., row k), we check whether If not, we randomly turn a gene (an entry in row k) from 0 to 1 until the constraint is satisfied
GA1 Continued • Phase 2. Assignment of flows • 2.1 Greedy assignment for each offspring Step 1: For each provider, determine the maximum quantity Qi that he can provide Step 2: Select the provider (i) with the smallest average cost per unit, given that he ships Qi to the manufacturing unit Step 3: Update the remaining demand and the capacity of provider i Step 4: Go to Step 1, unless the demand is fully satisfied Step 5: Calculate the total cost for each offspring
GA1 Continued • 2.2 Population selection/survival Given 50 parents and 50 children (after mutation), keep the best chromosome and select the remaining population for the next generation using proportional selection • Phase 3. Terminate or continue • If the best solution has remained the best for five consecutive generations, then terminate • Otherwise, return to Phase 1
Computational Results for Case One • Results are presented by Chauhan & Proth, EJOR, 2003 • We compare GA1 with CP on 20 benchmark problems • There are six providers and the variable cost functions are concave • GA1 beats CP on 6 and 14 ties • All 20 GA1 solutions are optimal (mention GA2) • GA1 running times are less than a second
Case Two Genetic Algorithm (GA2) • Initialization • Repeat Steps 1 - 4 50 times to obtain an initial population Step 1: Choose a manufacturing unit at random Step 2: Apply the greedy method discussed earlier (Phase 2, GA1) that uses the notion of smallest average cost per unit to satisfy demand at that manufacturing unit Step 3: Pick another manufacturing unit and go to Step 2 until the demands of all manufacturing units have been satisfied Step 4: Pij = 1 if provider i has been assigned to manufacturing unit j and Pij = 0 otherwise
GA2 Continued • At this point, we have an initial population • Each chromosome is an binary matrix • Each chromosome admits at least one feasible solution • Since we want to compare the results of GA2 with optimal solutions, we only consider linear variable costs as shown below.
GA2 Continued • For each chromosome in the population, we obtain a fitness (or cost) by solving the LP below (in MATLAB)
GA2 Continued • Phase 1. Select the edges in the graph • Crossover • Mutation • Phase 2. LP and assignment of flows • Given the edges for each offspring, use the LP model to obtain flows and total cost • Given 50 parents and 50 children, keep the best individual and select the remaining 49 for the next generation using proportional selection
GA2 Continued • Phase 3. Terminate or continue • If the best solution has remained the best for five consecutive generations, then terminate • Otherwise, return to Phase 1 • An illustration of GA2 • 3 providers and 4 manufacturing units • In the initialization step, we generate 50 chromosomes like the one on the next page
U1 P1 U2 P2 LP U3 P3 U4 Figure 4 An Illustration of GA2 • A chromosome • For every chromosome in the initial population, we solve the LP model to obtain its fitness (i.e., total cost)
U1 15 P1 10 U2 20 P2 25 15 U3 P3 U4 An Illustration of GA2 • The resulting flow network is at right • In Phase 1, we apply Queen-Bee crossover • The best solution is the Queen-Bee • We select 25 other individuals in proportion to their fitness to mate with the Queen • In crossover, we open the edge from provider i to unit j if it is open in the Queen or the other individual • Otherwise, the edge is not opened Figure 5
An Illustration of GA2 • Crossover between the Queen and another individual is shown below Figure 6 Figure 7 Figure 8
Greedy Method Greedy Method Figure 9 Figure 10 An Illustration of GA2 • After taking the union of edges, we apply the greedy method to eliminate redundant edges (see below) • This completes crossover
Greedy Method Figure 11 Figure 12 Figure 13 An Illustration of GA2 • The mutation operator is shown below • This completes Phase 1 Greedy Method
An Illustration of GA2 • We now have 25 children from crossover and 25 children from mutation • We use LP to determine the cost of each child • We determine the next generation, as indicated earlier • This completes Phase 2 • In Phase 3, we continue until the termination rule is satisfied • Optimal solutions to the MIP are obtained using Xpress • The MIP model is shown on the next page
MIP Formulation for Case Two • GA2 is coded in MATLAB • The experiments are run on a 3.06 GHz Pentium IV machine with 1GB RAM
Computational Results • GA cost is best of 10 replications • GA time (sec.) is the total over 10 replications
A Test of Robustness • We might be concerned about an unexpected increase in demand • If so, we can easily add an LP constraint within GA2 such as • The capacity of available suppliers should be large enough to handle a pre-specified demand increase at the manufacturing units • For example, we might plan for a demand increase of up to 3% at each manufacturing unit • GA3 is the solution with this added constraint • GA0 is the solution without it
Test of Robustness • The cost of a more robust solution is very small
Conclusions and Future Work • The GA is relatively simple, quick, and powerful • The GA solutions are within 5% of optimality • The GA can easily find robust solutions • The incremental cost is small • We think we can do a little better • This will be the focus of future work