Download
1 / 21
210 likes | 421 Views
Sonoma Valley Watershed Groundwater Recharge Mapping Project. Presentation to Basin Advisory Panel October 21, 2010. Sonoma Valley Groundwater Recharge Mapping Project. October 2010. A. Recharge Potential. 1) Vegetation. 2) Soil. 1) Land Use Analysis. Recharge Potential Map.

E N D
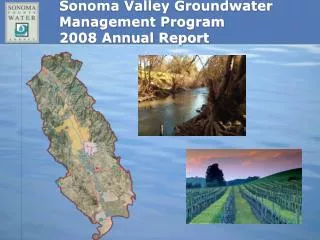
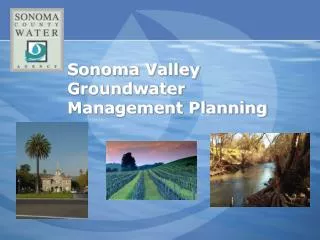
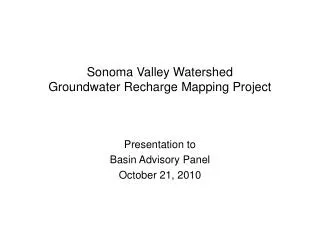
Sonoma Valley Watershed Groundwater Recharge Mapping Project Presentation to Basin Advisory Panel October 21, 2010
Sonoma Valley Groundwater Recharge Mapping Project October 2010 A. Recharge Potential 1) Vegetation 2) Soil 1) Land Use Analysis Recharge Potential Map 3) Slope 4) Geology Project Objective: Develop a groundwater recharge potential map for the Sonoma Valley and identify areas with high potential for use in project planning. B. Constraints Methodology 1) Impervious Surfaces 2) Depth to Ground Water C. Opportunities Opportunities for Recharge + 2) Enhanced Recharge Projects
A. Recharge Potential 1) The Vegetation Element (Weight: 10%)
A. Recharge Potential 2) The Soil Element (Weight 25%)
A. Recharge Potential 3) The Slope Element (Weight 15%)
A. Recharge Potential 4) The Geology Element (Weight 50%)
Sonoma Valley Groundwater Recharge Mapping Project October 2010 A. Recharge Potential 1) Vegetation 2) Soil 1) Land Use Analysis Recharge Potential Map 3) Slope 4) Geology Project Objective: Develop a groundwater recharge potential map for the Sonoma Valley and identify areas with high potential for use in project planning. B. Constraints Methodology 1) Impervious Surfaces 2) Depth to Ground Water C. Opportunities Opportunities for Recharge + 2) Enhanced Recharge Projects
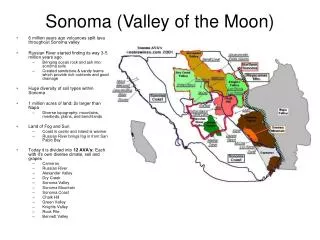
Objective: Identify Areas of High Recharge Potential • The main channel of Sonoma Creek from its emergence from the Mayacamas Mountains at Kenwood to the beginning of tidal influence near the Highway 12 crossing. • Much of the Yulupa Creek and Annadel Creek watersheds north of Bennett Valley Road. • The lower reaches of Calabazas, Stuart, and Butler Creeks and their floodplains below 450 feet elevation. • A lengthy area running northwest to southeast on the east slope of Sonoma Mountain that crosses the headwaters of Snag, Graham, Asbury, Mill, Winkle and Dowdall Creeks. • The lower reaches of Carriger/Fowler, Felder, Rodgers, Fryer, Nathanson, and Arroyo Seco Creeks. • The main channel of Hyde Creek for nearly its entire length. • The bulk of main stream channels for Pharris and Tolay Creeks. • Numerous small, un-named streams throughout Sonoma Valley have areas of modest size but high recharge potential. • The entire valley floor from Verano Avenue south to the beginning of tidal influence near Highways 12 and 121 (moderately high recharge potential).
Land Ownership Analysis • 73 percent of Sonoma Valley is privately owned. • 88 percent of areas with very good recharge potential is private. • Future initiatives seeking candidates for recharge projects will need to address the interests of private land owners, identifying their concerns and presenting appealing options. • 19 percent of Sonoma Valley is conserved land. • 9 percent of areas with very good recharge potential are conserved. • These lands may present lesser obstacles and good candidate sites may be more easily identified. Perhaps there are showcase opportunities here. • Less than 8 percent of Sonoma Valley is public. • 2.5 percent of areas with very good recharge potential are public. • Fewer opportunities here due to small acreage. Perhaps there are showcase opportunities here.
B. Constraints 1) Impervious Surfaces
Impervious Surfaces Analysis • 88 percent of Sonoma Valley is in category of 0 - 1 percent impervious surface rating. • 72 percent of very good recharge potential lies in areas with impervious surfaces ratings of 0 - 1 percent. • These areas tend to be rural. • Very little area high impervious surface ratings are good or very good recharge potential. • Not much opportunity for projects here. • 15 percent of very good and 10 percent of good recharge potential are in areas of 25 percent or less impervious surfaces • These areas often represent low to medium density single-family residence areas. • This is an opportunity area.
Land Use Analysis, First Step - Vineyard • Nearly two thirds of vineyard acreage has recharge potential rating of good or very good.
Sonoma Valley Groundwater Recharge Mapping Project October 2010 A. Recharge Potential 1) Vegetation 2) Soil 1) Land Use Analysis Recharge Potential Map 3) Slope 4) Geology Project Objective: Develop a groundwater recharge potential map for the Sonoma Valley and identify areas with high potential for use in project planning. B. Constraints Methodology 1) Impervious Surfaces 2) Depth to Ground Water C. Opportunities Opportunities for Recharge + 2) Enhanced Recharge Projects
Results of Investigation into Groundwater Recharge Mapping Methods