Unsupervised Clustering for Noise Reduction in Nuclear Medicine Imaging
180 likes | 231 Views
Explore the use of similarity-based clustering with the EM algorithm to reduce noise in nuclear medicine imaging studies, leveraging temporal correlations for enhanced image reconstruction. Incorporates spatially adaptive temporal filtering for improved results.

Unsupervised Clustering for Noise Reduction in Nuclear Medicine Imaging
E N D
Presentation Transcript
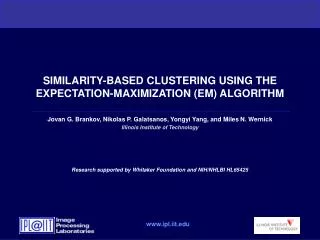
SIMILARITY-BASED CLUSTERING USING THE EXPECTATION-MAXIMIZATION (EM) ALGORITHM Jovan G. Brankov, Nikolas P. Galatsanos, Yongyi Yang, and Miles N. Wernick Illinois Institute of Technology Research supported by Whitaker Foundation and NIH/NHLBI HL65425 www.ipl.iit.edu
Motivation: Noise reduction in nuclear medicine • Frames of dynamic and gated imaging studies can be noisy; • Image sequences can benefit from special reconstruction techniques that utilize spatio-temporal correlations in the signal; • In practice temporal correlation is NOT spatially stationary. • The useful information is usually non-stationary. • Increase temporal correlation by: • Motion compensation; • gated myocardial perfusion study • Identifying spatial regions with similar temporal statistics to be processed similarly. • Hemodynamic response studies www.ipl.iit.edu
Ongoing 4D reconstruction project • Context within the project; • Temporal Karhunen-Loeve (KL) pre-smoothing (1995) (Method Ia); • Fully 4D reconstruction for dynamic PET using KL (1997); • 4D gated SPECT reconstruction by KL (1998); • Used unsupervised clustering + KL for fine-tuning (1999)(Method Ib); • 4D gated SPECT algorithm with motion compensated post smoothing (2001); • 4D gated SPECT algorithm with motion compensated reconstruction (2002). • Method Ia was designed for motionless objects with spatially stationary statistic; • In this paper, we propose an improved unsupervised clustering algorithm to be incorporated in Method Ib. www.ipl.iit.edu
Method Ib : Spatially adaptive temporal filtering • Identify spatial regions in projection domain having similar temporal characteristics; • k-means unsupervised clustering algorithm • Apply different temporal KLT to each spatial region, adapting the smoothing to the local temporal behavior; • Reconstruct images from smoothed projections. k-means algorithm is NOT well suited for this task (dependent on the signal amplitude) www.ipl.iit.edu
Motivation: Identifying region with similar temporal behavior Time activity curves (TAC) Realistic MRI voxel-based numerical brain phantom developed by Zubal et al. [11C] Carfentanil Study JJ Frost et al.1990 I. G. Zubal, C. R. Harrell, E. O. Smith, Z. Rattner, G. R. Ginde, and P. B. Hoffer, “Computerized three-dimensional segmented human anatomy,” Med. Phys, vol. 21, pp. 299-302, 1994. www.ipl.iit.edu
Model description • Observation generated by set of unique M-dimensional vectors each with unit norm,E=[e1, e2,... eK],; • Our objective is to estimate the parameters of the proposed model: the class label, the prior class probabilities, and the distinct directions . Model: Yn - nth observation Xn - class label; an - is the unknown amplitude of the nth observation. www.ipl.iit.edu
Probability density function: Basic Idea • For the same strength of additive noise, observed direction confidence increases with signal amplitude. Y1 ,Y2- observation Noise - additive noise eX1 =eX2- unique direction www.ipl.iit.edu
W1 W2 A2 A1 A2>A1 => W1<W2 Probability density function • Similarity measurement defined as the cosine of the angle between two vectors; • Similarity: • We approximate a angular distribution by the following truncated exponential distribution: where SNR is a concentration parameter and is a normalizing constant. • : www.ipl.iit.edu
Probability density function • Why truncated exponential distribution? • If M is 2 (2D case) this is a first order approximation of phase distribution for a signal corrupted with additive Gaussian random process (Rician pdf); • It can be shown that this is the distribution of spherically warped normal distribution (Madia, 1972); • Produces better results. www.ipl.iit.edu
Complete data • Now we can define a mixture model that can be solved by theexpectation maximization (EM) algorithm. • Complete data uniquely defines the model parameters; • Expected log-likelihood function of complete data: where with , and www.ipl.iit.edu
Expectation maximization algorithm for SCA www.ipl.iit.edu
Winner-take-all SCA www.ipl.iit.edu
Unsupervised clustering methods • Traditional clustering algorithms are dependent on the signal amplitude; • Gaussian mixture models (GMM)* (special case probabilistic PCA) • k-means* • winner-take-all variant of GMM • Principal component analysis (PCA); • basis functions are orthogonal • Independent component analysis (ICA); • components are independent • Clustered component analysis (CCA)1 (Bouman et al.) partially avoids the amplitude dependency*; ( also a special case probabilistic PCA) • Newly proposed method to determine distinct time activity curves existing in an image sequence (SCA).(want to neglect multiplicative scale factors) * compared with later 1C. A. Bouman, S. Chen, and M. J. Lowe, “Clustered Component Analysis for fMRI Signals estimation and Classification,” IEEE Tran. Image Proc., vol. 1, pp. 609-612, 2000. www.ipl.iit.edu
Visual comparison • 3 classes assumed • Results demonstrate the feasibility of the proposed SCA concept. www.ipl.iit.edu
Quantitative comparison Percent correctly classified • Among the tested methods, the proposed algorithms have the best accuracy and lowest computational complexity. www.ipl.iit.edu
Sensitivity • 4 classes assumed www.ipl.iit.edu
Conclusion • Results presented here demonstrate the feasibility of the proposed SCA concept. • Among the tested methods, the proposed algorithms have the best accuracy and lowest computational complexity. www.ipl.iit.edu
Future efforts • Aim: • Incorporating a minimum description length (MDL) criterion to automatically estimate number of classes. • Explorr possible applications: • Automated kinetic model parameter estimation; • Temporal pre/post smoothing; • Spatio-temporal reconstruction; • Image segmentation based on color (neglecting color intensity). www.ipl.iit.edu