Download
1 / 12
120 likes | 259 Views
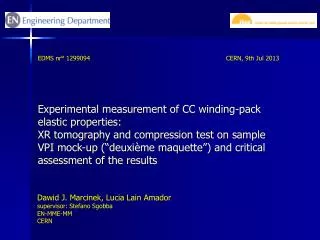
EDMS nr° 1299094 . CERN , 9th Jul 2013. Experimental measurement of CC winding-pack elastic properties : XR tomography and compression test on sample VPI mock-up (“ deuxième maquette ”) and critical assessment of the results. Dawid J. Marcinek, Lucia Lain Amador

E N D
EDMS nr°1299094 CERN, 9thJul2013 Experimental measurement of CC winding-pack elastic properties: XR tomography and compression test on sample VPI mock-up (“deuxièmemaquette”) and critical assessment of the results Dawid J. Marcinek, Lucia Lain Amador supervisor: Stefano Sgobba EN-MME-MM CERN
VPI mock-up 2nd sample 3rd mock-up Summary of previous tests • 2ndsample of the 3rd VPI mock-up: • 3D tomography by RX Solutions EDMS nr° 1258209 Results presented during the “CC sub-IPT Meeting” in Cadarache, Dec. 17-19, 2012 • 2ndsample of 3rd VPI mock-up: • Compression test EDMS nr° 1280238 Results presented during the “CC sub-IPT Meeting” in Cadarache, Apr. 16-18, 2012 2nd sample of the VPI Top • 2nd sample of the 3rdVPI mock-up • separated in parts: • Compression test of Top, Bottom • and Middle part • Max Force of 50kN and 180 kN • Compression with Zwick/Roell Z400 • Max force 400kN • Tensile tests of Top and Bottom resin Zwick/Roell Compression test of 2nd VPI Middle Bottom EDMS nr° 1287211
VPI mock-up (“deuxièmemaquette”) Compression test Experimental data The present VPI mock-up (“deuxièmemaquette”) underwent only a first VPI after ground insulation. This has to be taken into account when comparing compression results with previous sample (2nd sample of 3rd VPI mock-up). 2nd sample (from 3rd VPI mock-up) “deuxièmemaquette”
3D tomography Technique description • Specimens placed on a mobile and rotatable stage • Motorized zoom • Full inspection of samples up to 240 mm length • Sealed microfocus source, max. tension150 kV • HR area image sensor, 1920 pixels x 1536 pixels • Detection surface: 200 mm x 250 mm • 14 bits – 16000 gray levels • 1-30 images /s VPI mock-up (“deuxièmemaquette”) 11 separate 360° scans were combined to compile a final single3D object reconstructionwhileavoiding shadows due to steel conduits
3D tomography View in myVGL software
3D tomography View in myVGL software
3D tomography View in myVGL software
Compression tests on Zwick/Roell Z400 Two compressiontests have been performed on the sampleafter machining the surfaces: following loading axis Y and loading axis X, up to 30 MPa and 0.2 kN/s speed with preload of 5 kN. After machining the surfaces, parallelism better than 0.02 (0.05) mm is reached between the faces perpendicular to y (x). • Material: ITER CC “deuxièmemaquette” VPI mock-up provided by ASIPP • Test machine: Zwick/Roell Z400 machine that can provide a force of 400 kN (rigid plates dimensioned for a 800 kN force) • Comparators: Four LVDTs were used to measure the displacement of the plate • Type of test: Compression at room temperature • Testspeed: 0.2 kN/s y x • Neither visually nor acoustically, signs of damage could be detected up to this maximum force.
VPI mock-up (“deuxièmemaquette”) Compression test Y axis The graph on the left shows stress against strain, elastic modulus directly provided by the average slope The graph on the bottom shows the part of unloading curve just below 30 MPawhich is the part of the curve used to calculate the elastic modulus One LVDT gave unexploitable signal and was not considered • Ey_load,30 MPa= 11.4 GPa • ky_load,30 MPa= 448.9 kN/mm
VPI mock-up (“deuxièmemaquette”) Compression test X axis • The graph on the left shows stress against strain, elastic modulus directly provided by the average slope • The graph on the bottom shows the part of unloading curve just below 30 MPawhich is the part of the curve used to calculate the elastic modulus • Ex_load,30 MPa= 12.2 GPa • kx_load,30 MPa= 765.8 kN/mm Only 2 LVDTs were available and used due to the limited height of the sample in this direction.
Comparison of stress-strain curves from VPI mock-up “deuxièmemaquette” and Second sample of 3rdVPI mock-up (middle part). Compression test, Y axis Elastic modulus calculated from the unloading portion EDeuxieme_maquette,LVDT_02 = 10.8 GPa ESecond_sample_of3rd_mock_up, middle_part, LVDT_01= 12.2 GPa
Conclusions • The compression test on the “deuxièmemaquette” of VPI mock-up by Zwick/Roell Z400 testing device assesses an elastic modulus of 11.4 GPain “y” loading axis . This is not far with previous results on 2nd sample of 3rd VPI mock-up (12.2 GPa for the middle part and 10.2 GPa for whole sample) despite the absence of the protection layer • The compression test on x loading axis gives a modulus of 12.2 GPaand suggest quite isotropic behaviour between “y” and “x” loading axis • 3D tomography performed on “deuxièmemaquette” of VPI mock-up allowed extensive investigation of impregnation quality without any destructive cuts of tested piece. Results confirmed high defectivity, consisting mainly in elongated voids in resin along glass ropes between the steel conduits (slide 6 and 7)