Download
1 / 22
220 likes | 631 Views
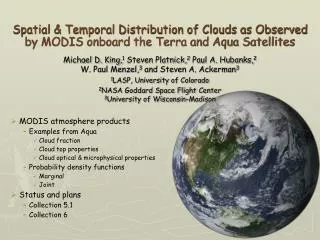
Spatial & Temporal Distribution of Clouds as Observed by MODIS onboard the Terra and Aqua Satellites. MODIS atmosphere products Examples from Aqua Cloud fraction Cloud top properties Cloud optical & microphysical properties Probability density functions Marginal Joint Status and plans

E N D
Spatial & Temporal Distribution of Clouds as Observed by MODIS onboard the Terra and Aqua Satellites • MODIS atmosphere products • Examples from Aqua • Cloud fraction • Cloud top properties • Cloud optical & microphysical properties • Probability density functions • Marginal • Joint • Status and plans • Collection 5.1 • Collection 6 Michael D. King,1 Steven Platnick,2 Paul A. Hubanks,2 W. Paul Menzel,3 and Steven A. Ackerman3 1LASP, University of Colorado 2NASA Goddard Space Flight Center 3University of Wisconsin-Madison
Gridded Level-3 Joint Atmosphere Products(M. D. King, S. Platnick, P. A. Hubanks – NASA GSFC) • Daily, 8-day, and monthly products (97, 255, 255 MB) • 20-25% of the size of these products in Collection 4 • Files contain more SDSs, but are stored with internal hdf compression • 1° ´1° equal angle grid • Statistics • Mean, standard deviation, minimum, maximum • QA mean, QA standard deviation • Cloud fraction, pixel counts • Log mean, log standard deviation (useful for cloud inhomogeneity studies) • Mean uncertainty, QA mean uncertainty • Marginal probability density functions for cloud properties • Histogram counts, confidence histograms • Joint probability density functions • Joint histograms between various cloud properties (e.g., cloud optical thickness vs cloud top pressure)
Monthly Mean Cloud Fraction (S. A. Ackerman, R. A. Frey et al. – Univ. Wisconsin) Aqua/MODIS • Cloud fraction similar during day and night (in Collection 5) • High cloud amount • Roaring 40s • ITCZ • North Atlantic • Indonesia and western tropical Pacific • Low cloud amount • Subtropical gyres over the ocean • Deserts • Antarctica • Greenland July 2006
Zonal Mean Cloud Fraction(S. A. Ackerman, R. A. Frey et al. – Univ. Wisconsin) July 2006
Time Series of Cloud Fraction during the Daytime(M. D. King, S. Platnick et al. – NASA GSFC) July 2002 – January 2007
Aqua Cloud Fraction – Terra Cloud Fraction (M. D. King, S. Platnick et al. – NASA GSFC) • Terra • Higher over oceans than land • Marine stratocumulus • Aqua • Higher over land than ocean • Interior continents • Desert southwestern US • Australia • Higher over ocean than land • Northern Indian Ocean July 2006
Zonal Mean Cloud Fraction by Phase(M. D. King, S. Platnick et al. – NASA GSFC) July 2006 Liquid Water Cloud
Zonal Mean Cloud Fraction by Phase(M. D. King, S. Platnick et al. – NASA GSFC) July 2006 Ice Cloud
Aqua Cloud Fraction – Terra Cloud Fraction(M. D. King, S. Platnick et al. – NASA GSFC) July 2006 • Liquid Water Clouds • Terra • Greater over oceans • Greater over northern Amazonia • Ice Clouds • Aqua • Greater over continents • Greater over ITCZ • Aqua shows more ice clouds, especially over land • Terra shows more liquid clouds, especially over ocean
Monthly Mean Cloud Fraction by Phase (M. D. King, S. Platnick et al. – NASA GSFC) July 2006 Aqua • Liquid water clouds • Marine stratocumulus regions • Angola/Namibia • Peru/Ecuador • California/Mexico • Ice clouds • Tropics • Indonesia & western tropical Pacific • ITCZ • Roaring 40s
Monthly Mean Cloud Top Properties(W. P. Menzel, R. A. Frey et al. – Univ. Wisconsin) Aqua/MODIS • Cloud top pressure and temperature low (high clouds) • ITCZ • Deserts • India and China land • Western tropical Pacific • Northern Indian Ocean • Greenland • Antarctica • Cloud top pressure and temperature high (low clouds) • Central ocean gyres • Southern Indian Ocean • Western Europe July 2006
Zonal Mean Cloud Top Pressure(W. P. Menzel, R. A. Frey et al. – Univ. Wisconsin) July 2006
Monthly Mean Cloud Optical Thickness(M. D. King, S. Platnick et al. – NASA GSFC) July 2006 Aqua (QA Mean) • Liquid water clouds • Marine stratocumulus c ~ 15 • Higher optical thickness over land than ocean • Cloud optical thickness ~5 in Indian Ocean • High optical thickness around roaring 40s • Ice clouds • Larger in tropics (ITCZ) • High where deep convection occurs • Congo basin • Amazon basin • High optical thickness around roaring 40s • Higher over land than ocean
Monthly Mean Cloud Effective Radius(M. D. King, S. Platnick et al. – NASA GSFC) July 2006 Aqua (QA Mean) • Liquid water clouds • Larger drops in SH than NH • Larger drops over ocean than land • Due to cloud condensation nuclei (aerosols) • Ice clouds • Larger in tropics than high latitudes • Anvils • Small ice crystals at top of deep convection
Zonal Mean Cloud Effective Radius(M. D. King, S. Platnick et al. – NASA GSFC) July 2006
Marginal Histograms of Cloud Optical ThicknessSouth Atlantic Ocean Terra March 30 – April 6, 2005
Marginal Histograms of Cloud Effective RadiusSouth Atlantic Ocean Terra March 30 – April 6, 2005
MODIS c vs re Joint HistogramsLiquid Water Clouds over Ocean 32°-40°N, 117°-125°W June 2005
ISCCP-like c vs pc Joint Histograms 50°N-50°S Terra August 2001
MODIS c vs pc Joint HistogramsIce Clouds 50°N-50°S Terra August 2001
MODIS c vs pc Joint HistogramsLiquid Water Clouds 50°N-50°S Terra August 2001
Status and Plans for Collection 6 • Terra and Aqua • MODIS atmosphere products (descriptions, level-1b and level-3 browse imagery, documentation, contact information, tools for working with and ordering data…) • modis-atmos.gsfc.nasa.gov • Data available for browse (level-1 and atmosphere level-2 and level-3) and ordering at Level 1 and Atmosphere Archive and Distribution System (LAADS) • ladsweb.nascom.nasa.gov • Plans for the future • Collection 5.1 enhancements and reprocessing • Atmosphere reprocessing of Aqua to begin on May 21, 2008 (beginning of Aqua around July 4, 2002 to August 2007) and complete in September 21, 2008 • Atmosphere reprocessing of Terra to begin on September 16, 2008 (beginning of Terra around February 24, 2000 to August 2007) and complete in February 2009 • To include Deep Blue aerosol algorithm • Collection 6 enhancements and processing • Atmosphere initial delivery of code in November 2008 for initial testing • Atmosphere processing of Terra and Aqua to begin in February 2009