Download
1 / 1
10 likes | 162 Views
(b) The Antarctic (SSM/I: 2005. 9. 25, 7900kmⅹ7900km). (a) The Arctic (SSM/I: 2005. 8. 5, 6350kmⅹ6350km). M+F. Figure 1. Kompsat-1 EOC orbits of the Arctic and Antarctic overlying SSMI sea ice concentration image. Y. O. N. (b) The Antarctic (2005. 10. 5, 17.4kmⅹ18.7km).

E N D
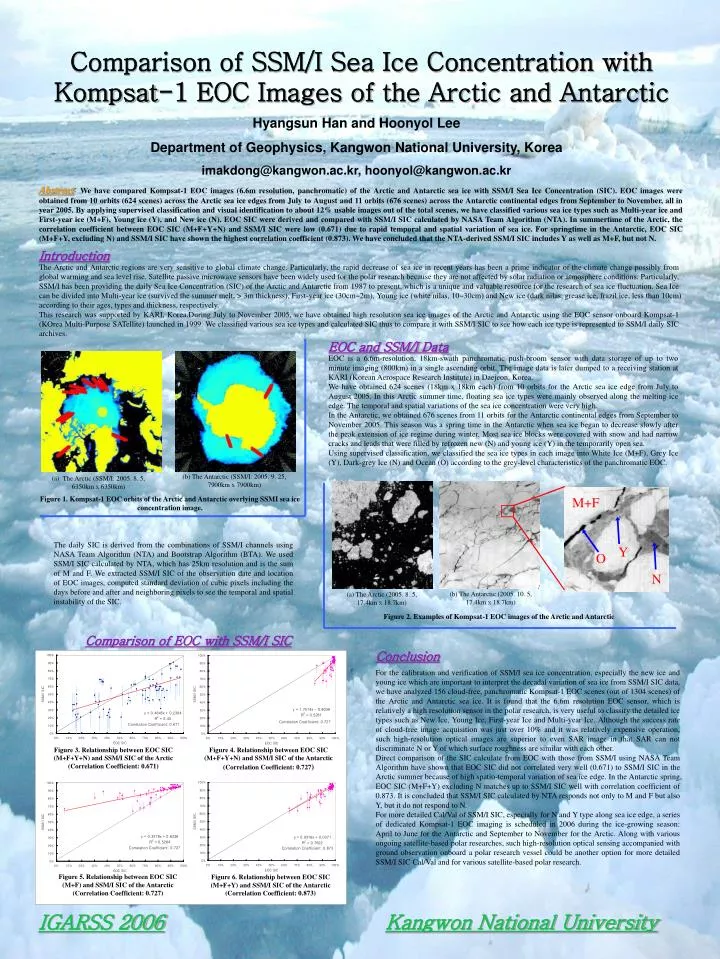
(b) The Antarctic (SSM/I: 2005. 9. 25, 7900kmⅹ7900km) (a) The Arctic (SSM/I: 2005. 8. 5, 6350kmⅹ6350km) M+F Figure 1. Kompsat-1 EOC orbits of the Arctic and Antarctic overlying SSMI sea ice concentration image. Y O N (b) The Antarctic (2005. 10. 5, 17.4kmⅹ18.7km) (a) The Arctic (2005. 8. 5, 17.4kmⅹ18.7km) Comparison of EOC with SSM/I SIC Figure 3. Relationship between EOC SIC (M+F+Y+N) and SSM/I SIC of the Arctic (Correlation Coefficient: 0.671) Figure 4. Relationship between EOC SIC (M+F+Y+N) and SSM/I SIC of the Antarctic (Correlation Coefficient: 0.727) Figure 5. Relationship between EOC SIC (M+F) and SSM/I SIC of the Antarctic (Correlation Coefficient: 0.727) Figure 6. Relationship between EOC SIC (M+F+Y) and SSM/I SIC of the Antarctic (Correlation Coefficient: 0.873) Comparison of SSM/I Sea Ice Concentration with Kompsat-1 EOC Images of the Arctic and Antarctic Hyangsun Han and Hoonyol Lee Department of Geophysics, Kangwon National University, Korea imakdong@kangwon.ac.kr, hoonyol@kangwon.ac.kr Abstract: We have compared Kompsat-1 EOC images (6.6m resolution, panchromatic) of the Arctic and Antarctic sea ice with SSM/I Sea Ice Concentration (SIC). EOC images were obtained from 10 orbits (624 scenes) across the Arctic sea ice edges from July to August and 11 orbits (676 scenes) across the Antarctic continental edges from September to November, all in year 2005. By applying supervised classification and visual identification to about 12% usable images out of the total scenes, we have classified various sea ice types such as Multi-year ice and First-year ice (M+F), Young ice (Y), and New ice (N). EOC SIC were derived and compared with SSM/I SIC calculated by NASA Team Algorithm (NTA). In summertime of the Arctic, the correlation coefficient between EOC SIC (M+F+Y+N) and SSM/I SIC were low (0.671) due to rapid temporal and spatial variation of sea ice. For springtime in the Antarctic, EOC SIC (M+F+Y, excluding N) and SSM/I SIC have shown the highest correlation coefficient (0.873). We have concluded that the NTA-derived SSM/I SIC includes Y as well as M+F, but not N. Introduction The Arctic and Antarctic regions are very sensitive to global climate change. Particularly, the rapid decrease of sea ice in recent years has been a prime indicator of the climate change possibly from global warming and sea level rise. Satellite passive microwave sensors have been widely used for the polar research because they are not affected by solar radiation or atmosphere conditions. Particularly, SSM/I has been providing the daily Sea Ice Concentration (SIC) of the Arctic and Antarctic from 1987 to present, which is a unique and valuable resource for the research of sea ice fluctuation. Sea Ice can be divided into Multi-year ice (survived the summer melt, > 3m thickness), First-year ice (30cm~2m), Young ice (white nilas, 10~30cm) and New ice (dark nilas, grease ice, frazil ice, less than 10cm) according to their ages, types and thickness, respectively. This research was supported by KARI, Korea.During July to November 2005, we have obtained high resolution sea ice images of the Arctic and Antarctic using the EOC sensor onboard Kompsat-1 (KOrea Multi-Purpose SATellite) launched in 1999. We classified various sea ice types and calculated SIC thus to compare it with SSM/I SIC to see how each ice type is represented to SSM/I daily SIC archives. EOC and SSM/I Data EOC is a 6.6m-resolution, 18km-swath panchromatic push-broom sensor with data storage of up to two minute imaging (800km) in a single ascending orbit. The image data is later dumped to a receiving station at KARI (Korean Aerospace Research Institute) in Daejeon, Korea. We have obtained 624 scenes (18km x 18km each) from 10 orbits for the Arctic sea ice edge from July to August 2005. In this Arctic summer time, floating sea ice types were mainly observed along the melting ice edge. The temporal and spatial variations of the sea ice concentration were very high. In the Antarctic, we obtained 676 scenes from 11 orbits for the Antarctic continental edges from September to November 2005. This season was a spring time in the Antarctic when sea ice began to decrease slowly after the peak extension of ice regime during winter. Most sea ice blocks were covered with snow and had narrow cracks and leads that were filled by refrozen new (N) and young ice (Y) in the temporarily open sea. Using supervised classification, we classified the sea ice types in each image into White Ice (M+F), Grey Ice (Y), Dark-grey Ice (N) and Ocean (O) according to the grey-level characteristics of the panchromatic EOC. The daily SIC is derived from the combinations of SSM/I channels using NASA Team Algorithm (NTA) and Bootstrap Algorithm (BTA). We used SSM/I SIC calculated by NTA, which has 25km resolution and is the sum of M and F. We extracted SSM/I SIC of the observation date and location of EOC images, computed standard deviation of cubic pixels including the days before and after and neighboring pixels to see the temporal and spatial instability of the SIC. Figure 2. Examples of Kompsat-1 EOC images of the Arctic and Antarctic Conclusion For the calibration and verification of SSM/I sea ice concentration, especially the new ice and young ice which are important to interpret the decadal variation of sea ice from SSM/I SIC data, we have analyzed 156 cloud-free, panchromatic Kompsat-1 EOC scenes (out of 1304 scenes) of the Arctic and Antarctic sea ice. It is found that the 6.6m resolution EOC sensor, which is relatively a high resolution sensor in the polar research, is very useful to classify the detailed ice types such as New Ice, Young Ice, First-year Ice and Multi-year Ice. Although the success rate of cloud-free image acquisition was just over 10% and it was relatively expensive operation, such high-resolution optical images are superior to even SAR image in that SAR can not discriminate N or Y of which surface roughness are similar with each other. Direct comparison of the SIC calculate from EOC with those from SSM/I using NASA Team Algorithm have shown that EOC SIC did not correlated very well (0.671) to SSM/I SIC in the Arctic summer because of high spatio-temporal variation of sea ice edge. In the Antarctic spring, EOC SIC (M+F+Y) excluding N matches up to SSM/I SIC well with correlation coefficient of 0.873. It is concluded that SSM/I SIC calculated by NTA responds not only to M and F but also Y, but it do not respond to N. For more detailed Cal/Val of SSM/I SIC, especially for N and Y type along sea ice edge, a series of dedicated Kompsat-1 EOC imaging is scheduled in 2006 during the ice-growing season: April to June for the Antarctic and September to November for the Arctic. Along with various ongoing satellite-based polar researches, such high-resolution optical sensing accompanied with ground observation onboard a polar research vessel could be another option for more detailed SSM/I SIC Cal/Val and for various satellite-based polar research. Kangwon National University IGARSS 2006