Download
1 / 69
700 likes | 917 Views
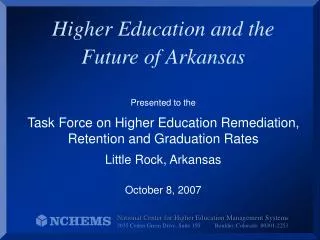
National Center for Higher Education Management Systems 3035 Center Green Drive, Suite 150 Boulder, Colorado 80301-2251. Higher Education and the Future of Arkansas. Presented to the Task Force on Higher Education Remediation, Retention and Graduation Rates Little Rock, Arkansas

E N D
National Center for Higher Education Management Systems 3035 Center Green Drive, Suite 150 Boulder, Colorado 80301-2251 Higher Education and the Future of Arkansas Presented to the Task Force on Higher Education Remediation, Retention and Graduation Rates Little Rock, Arkansas October 8, 2007
CT CT 28,766 28,766 NJ NJ MA MA MD MD CO CO VA VA NH NH NY DE DE MN IL IL WA CA CA AK AK MI Per Capita Income NV NV RI RI FL HI HI WI GA GA OH OH OR OR PA VT VT KS KS IN IN NC AZ MO MO TX NE IA ME TN TN WY WY SC SC AL AL UT UT KY KY ID ND OK OK SD NM NM MT MT AR AR LA LA WV WV MS MS 15,853 15,853 14.8 14.8 33.2 Percent with Bachelor’s Degree or Higher Relationship Between Educational Attainment and Personal Income by State, 2000 Source: U.S. Census Bureau, 2000 Census
30 30 MN MN MN MN MN MN MN MN MN NH NH NH NH NH NH NH NH NH VT VT VT VT VT VT VT VT VT UT UT UT UT UT UT UT UT UT HI HI HI HI HI HI HI HI HI MA MA MA MA MA MA MA MA MA ND CT CT CT CT CT CT CT CT CT 15 15 WI WI WI WI WI WI WI WI WI IA IA IA IA IA IA IA IA IA ME ME ME ME ME ME ME ME ME NE NE NE NE NE NE NE NE NE CO CO CO CO CO CO CO CO CO RI RI RI RI RI RI RI RI RI WA WA WA WA WA WA WA WA WA KS KS KS KS KS KS KS KS KS NJ NJ NJ NJ NJ NJ NJ NJ NJ SD SD SD SD SD SD SD SD SD VA VA VA VA VA VA VA VA VA ID ID ID ID ID ID ID ID ID OR OR OR OR OR OR OR OR OR PA PA PA CA CA CA CA CA CA CA CA CA AZ AZ AZ AZ AZ AZ AZ AZ AZ AK AK AK OH OH OH OH OH OH OH OH OH MT MT MT MT MT MT MT MT MT WY WY WY WY WY WY WY WY WY State Health Index—United Health Foundation IL IL IL IL IL IL IL IL IL NY NY NY NY NY NY NY NY NY IN IN IN IN IN IN IN IN IN US DE DE DE 0 0 MI MI MI MI MI MI MI MI MI MD MD MD MD MD MD MD MD MD TX TX TX TX TX TX TX TX TX MO MO MO MO MO MO MO MO MO NV NV NV NV NV NV NV NV NV NM NM NM KY KY KY KY KY KY KY KY KY OK OK OK NC NC NC FL FL FL FL FL FL FL FL FL WV WV WV WV WV WV WV WV WV AL AL AL AL AL AL AL AL AL GA GA GA AR SC SC SC TN TN TN - - - - - - - - 15 15 MS MS MS MS MS MS MS MS MS LA LA LA LA LA LA LA LA LA - - - - - - - - 30 30 10% 10% 20% 20% 30% 30% 40% 40% Percent of Adults 25-64 with a Bachelor’s Degree or Higher Relationship Between Educational Attainment and Health, 2000 Source: U.S. Census Bureau, 2000 Census; United Health Foundation
$45,000 CT 40,000 Correlation = 0.84 MA NJ MD NY 35,000 CO NH MN VA DE IL Personal Income Per Capita CA AK WA RI WY PA NV US MI NE HI VT FL WI 30,000 OH KS MO OR TX SD IN ND GA ME IA TN NC AZ OK MT AL SC LA KY UT 25,000 ID NM WV AR MS 20,000 Actual Tax Revenues Per Capita $2,000 3,000 4,000 5,000 Relationship Between Personal Income and Tax Revenues, 2003
Per Capita Personal Income as a Percent of U.S. Average—Arkansas, 1960-2005 Source: Regional Economic Information System, Bureau of Economic Analysis, U.S. Department of Commerce
Randolph Baxter Carroll Benton Fulton Clay Boone Marion Izard Sharp Greene Lawrence Madison Washington Newton Searcy Mississippi Independence Stone Craighead Franklin Van Buren Poinsett Johnson Cleburne Crawford Jackson Pope Conway Cross White Logan Crittenden Sebastian Faulkner Woodruff Yell St. Francis Prairie Perry Scott Pulaski Lonoke Lee Monroe Garland Saline Phillips Montgomery Polk 24,990 to 35,264 Grant Arkansas Hot Spring 23,141 to 24,990 Jefferson Pike 22,221 to 23,141 Sevier Clark Dallas 20,851 to 22,221 Cleveland Howard Lincoln Desha 17,618 to 20,851 Hempstead Little River Ouachita Drew Nevada Calhoun Miller Bradley Columbia Ashley Chicot Union Lafayette Per Capita Personal Income, 2004 Arkansas = $25,814 Source: Bureau of Economic Analysis
281,563 Projected Change in Arkansas Population By Age and Race/Ethnicity, 2006-25 Source: Arkansas Department of Economic Security and Commerce
80.3% 84.9% 6.2% 20.3% 6.5% Educational Attainment and Rank Among States—Arkansas, 2005 (Percent) Source: U.S. Census Bureau, 2005 American Community Survey (ACS)
Differences in College Attainment (Associate and Higher) Between Younger and Older Adults—U.S. and OECD Countries, 2004 Source: Education at a Glance 2006, Organisation for Economic Co-operation and Development (OECD)
Differences in College Attainment (Associate and Higher) Between Younger and Older Adults—U.S., 2005 Source: U.S. Census Bureau, American Community Survey 2005
Percent of Adults with an Associate Degree or Higher by Age Group—Arkansas, the U.S. and Leading OECD Countries Source: OECD, Education at a Glance 2006; U.S. Census Bureau, ACS 2005
55% of Population Age 25-64 with College Degrees The Goal: Arkansas Reaching International Competitiveness by 2025
1,318,974 1,175,054 Additional Degrees (Associate and Above) Needed in Adult Population Age 25-44 to Meet Top Country Performance* * In Canada, 50.13% of adults age 25-44 have college degrees (Associate and above). Source: U.S. Census Bureau, 2005 ACS; OECD
Reaching Top Performance by 2025 (55%)– Arkansas 835,336 202,622 632,714 309,266 16,592 306,856 15,343 111.1% Number of Individuals to Match Best-Performing Countries (55%) Number of Individuals (Age 25-44) Who Already Have Degrees Additional Production Needed (2005 to 2025) Degrees Produced at Current Annual Rate of Production Additional Residents with College Degrees from Net Migration Additional Degrees Needed Additional Degrees Needed per Year (Currently Produce 16,357 in All Sectors) Increase in Annual Associate and Bachelor’s Degree Production Needed (in Public Sector Only)
Collective Cost to Arkansas, Assuming Tuition Stays the Same $ 682 Million = Annual Costs of Additional Students at Current $ per Student $ 862 Million = Current State Contribution 79.1% = Percent Increase in Annual State Support Needed
Average Cost to Students, Assuming No Additional State Investment $ 3,985 = Additional Annual Costs to Students at Public Four-Year Institutions 117% Increase in Tuition and Fees (Currently $ 3,421) $ 2,683 = Additional Annual Costs to Students at Public Two-Year Institutions 217% Increase in Tuition and Fees (Currently $ 1,237)
Educational Attainment in Arkansas (Percent) Current, In 2025 with Current Degree Production, and Best-Performing Countries in 2025
Degrees Produced 2005-25 with Current Rate of Production Additional Degrees from Population Growth Additional Degrees from Net Migration of College-Educated Residents Reaching Best Performance in High School Graduation Rates by 2025 Reaching Best Performance in College-Going Rates by 2025 Reaching Best Performance in Rates of Degree Production per FTE Student Total Degrees Produced 2005-25 If All of the Above Degrees Needed to Meet Best Performance (55%) Pipeline Performance Is Cumulative How Can Arkansas Reach International Competitiveness? Current Degree Production Combined with Population Growth and Migration, and Best Performance* on the Student Transition and Completion Measures *Best performance = average of top three states
Native American/ Asian/ WhiteAfrican-AmericanHispanic/Latino Alaska Native Pacific Islander Males Males Males Males Males Females Females Females Females Females Bachelor's Degree or Higher All College Degrees (Associate or Higher) Norway Canada U.S. Index = 86% U.S. Index = 77% Percent Educational Attainment in Arkansas of Younger Workforce (Age 25-34)—Indexed to Most Educated Country, 2005 Source: U.S. Census Bureau’s 2005 American Community Survey; OECD
Percent of Civilian Population Age 25-64 Participating in the Workforce, 2000 Source: U.S. Census Bureau
Percent of Civilians Age 25-64 Participating in the Workforce by Level of Education, 2000 Source: IPUMS 5% Sample, Minnesota Population Center
Percent of Population Age 25-64 with Less than a High School Diploma, 2005 Source: U.S. Census Bureau, 2005 ACS
Randolph Baxter Carroll Benton Fulton Clay Boone Marion Izard Sharp Greene Lawrence Madison Washington Newton Searcy Mississippi Independence Stone Craighead Franklin Van Buren Poinsett Johnson Cleburne Crawford Jackson Pope Conway Cross White Logan Crittenden Sebastian Faulkner Woodruff Yell St. Francis Prairie Perry Scott Pulaski Lonoke Lee Monroe Garland Saline Phillips Montgomery Polk Grant Arkansas Hot Spring Jefferson Pike Sevier Clark Dallas Cleveland Howard Lincoln Desha 26 .8 to 36 .7 Hempstead Little River Ouachita Drew 22 .9 to 26 .8 Nevada Calhoun 20 .6 to 22 .9 Miller Bradley 18 .2 to 20 .6 Columbia Ashley Chicot Union Lafayette 12 .1 to 18 .2 Percent of Population Age 25-64 with Less than a High School Diploma, 2000 Arkansas = 19.1% Source: U.S. Census Bureau
Percent of Population Age 18-24 with Less than a High School Diploma, 2005 Source: U.S. Census Bureau, 2005 ACS
32.4 30.5 30.3 29.9 29.7 29.3 29.0 28.9 28.2 27.5 27.2 27.1 26.3 25.9 25.9 25.8 24.6 24.2 23.5 23.1 22.9 22.9 22.7 21.9 21.5 21.2 21.2 20.9 20.8 20.2 20.1 20.0 19.6 19.4 18.8 18.7 18.6 18.4 18.4 17.9 17.9 17.5 17.4 17.3 16.9 16.8 16.2 16.1 15.9 15.0 13.6 13.6 Adult Education and Literacy—Target Populations as a Percentage of All Adults Age 18-64 by State, 2005 Source: U.S. Census Bureau, 2005 ACS; PUMS Note: Incarcerated population not separated out.
340 GEDs Awarded to Adults Age 16-24 per 1,000 Adults Age 16-24* with Less than a High School Diploma or Equivalent, 2005 *Age 16-24 with no high school diploma or equivalent, not enrolled Source: GED Testing Service, U.S. Census Bureau, 2005 ACS
Pennsylvania Wyoming Arizona Change in Percentage of All GEDs Awarded to High School Students Age 16-18—By State, 1990 and 2005 Note: 1990 data not available for California, Hawaii, Idaho, Illinois, Louisiana, Nevada, West Virginia. Source: GED Testing Service
Percent of Population Age 25-64 with a Bachelor’s Degree or Higher, 2000 Source: U.S. Census Bureau, 2000
Randolph Baxter Carroll Benton Fulton Clay Boone Marion Izard Sharp Greene Lawrence Madison Washington Newton Searcy Mississippi Independence Stone Craighead Franklin Van Buren Poinsett Johnson Cleburne Crawford Jackson Pope Conway Cross White Logan Crittenden Sebastian Faulkner Woodruff Yell St. Francis Prairie Perry Scott Pulaski Lonoke Lee Monroe Garland Saline Phillips Montgomery Polk Grant Arkansas Hot Spring Jefferson Pike Sevier Clark Dallas Cleveland Howard Lincoln Desha 16 .5 to 30 .4 Hempstead Little River Ouachita Drew 13 .2 to 16 .5 Nevada Calhoun 11 .9 to 13 .2 Miller Bradley 10 .3 to 11 .9 Columbia Ashley Chicot Union Lafayette 6 .7 to 10 .3 Percent of Population Age 25-64 with a Bachelor’s Degree or Higher, 2000 Arkansas = 18.2% Source: U.S. Census Bureau
Student Pipeline, 2004 Of 100 9th Graders, How Many… Source: NCES Common Core Data, NCES IPEDS 2002 Residency and Migration Survey, ACT Institutional Survey, NCES IPEDS Graduation Rate Survey
Race/Ethnic Representation at Each Stage of the Education Pipeline, 2002 Source: U.S. Census Bureau; NCES Common Core Data; IPEDS Enrollment and Completions Surveys
High School Graduation Rates—Public High School Graduates as a Percent of 9th Graders Four Years Earlier, 2002 Source: Tom Mortenson, Postsecondary Opportunity
Arkansas Projected High School Graduates By Race/Ethnicity from 2000-01 to 2017-18 Source: Western Interstate Higher Education Commission (WICHE)
College-Going Rates—First-Time Freshmen Directly Out of High School as a Percent of Recent High School Graduates, 2002 Source: Tom Mortenson, Postsecondary Opportunity
Percentage of First-Time College Students Enrolled In-State Who Are Not Directly Out of High School—All Sectors, 2004 Source: NCES, IPEDS Fall Enrollment Survey 2004
Percentage of First-Time College Students Enrolled In-State Who Are Not Directly Out of High School—Public Two-Year Sectors, 2004 Source: NCES, IPEDS Fall Enrollment Survey 2004
Credentials Awarded (Two-Year or Less) Per 100 High School Graduates Three Years Earlier, 2003 Source: NCES Common Core Data, IPEDS Completion Survey
Bachelor’s Degrees Awarded per 100 High School Graduates Six Years Earlier, 2004 Source: NCES Common Core Data, IPEDS Completion Survey
Six-Year Graduation Rates at FourYear Colleges, 2005 (Percent) Source: NCES, IPEDS Graduation Rate Survey
Median Earnings by Degree Level, 2005 Note: Data represent persons age 25-64 with positive earnings working 35+ hours per week. Source: U.S. Census Bureau, 2005 PUMS
Difference in Median Earnings Between a High School Diploma and an Associate Degree, 2005 Source: U.S. Census Bureau, 2005 ACS PUMS File
Difference in Median Earnings Between a High School Diploma and a Bachelor’s Degree, 2005 Source: U.S. Census Bureau, 2005 ACS PUMS File
Percent of Residents Age 25-64 with a Bachelor’s Degree or Higher Born In-State, 2005 Source: 2005 ACS
Percent of Residents Age 25-64 with an Associate Degree Born In-State, 2005 Source: 2005 ACS
South Dakota Pennsylvania West Virginia North Dakota Rhode Island Mississippi Wisconsin Oklahoma New York Louisiana Nebraska Wyoming Alabama Montana Vermont Kansas Indiana Hawaii Alaska Ohio Utah Iowa Migration Rate* of College-Educated Residents Age 22-64—Associate and Higher, 1995-2000 * Per 1,000 residents age 22-64 with college degrees. Source: U.S. Census Bureau, PUMS (based on 2000 Census)
Net Migration by Degree Level and Age Group—Arkansas 22- to 29-Year-Olds 30- to 64-Year-Olds Less than High School High School Some College Associate Bachelor’s Graduate/Professional Total Source: U.S. Census Bureau, 2000 Public Use Microdata Samples (based on 2000 Decennial Census)