Goals
Lecture Notes: Econ 203 Introductory Microeconomics Lecture/Chapter 13: Costs of Production M. Cary Leahey Manhattan College Fall 2012. Goals. Introduction to the theory of the firm New “buzz words” developed here: Production function Price and marginal revenue (MR) and cost (MC)

Goals
E N D
Presentation Transcript
Lecture Notes: Econ 203 Introductory MicroeconomicsLecture/Chapter 13: Costs of Production M. Cary LeaheyManhattan CollegeFall 2012
Goals • Introduction to the theory of the firm • New “buzz words” developed here: • Production function • Price and marginal revenue (MR) and cost (MC) • Marginal costs and average total costs (ATC) • Classification of costs: • Fixed versus variable • Implicit versus explicit • Distinction between short- and long-runs • Economies of scale
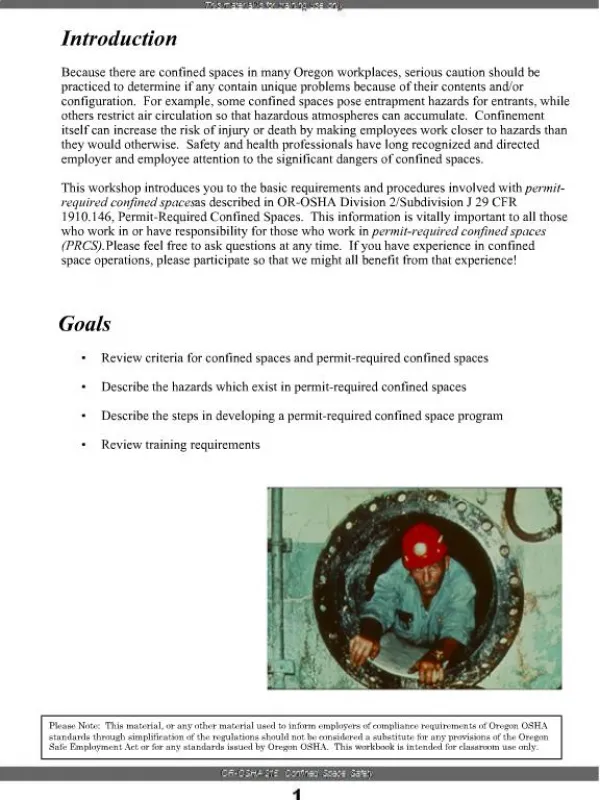
Introduction: what do firms want to do? Review of what are firm’s costs in your opinion (e.g. Ford) Company goal – profit maximization Profit = Total revenue – total costs Total revenue – total amount received from sale of output Total costs – market value of the inputs used to produce output Alternatives – revenue maximization (ML) market share maximization (Japan) social profit/sustainability 3
Costs: explicit or implicit; profit: economic or accounting Explicit costs are money costs (determined by the market) Usually largest costs are wages/benefits followed by IT Implicit costs do not require a cash outlay Opportunity cost of the owner’s time Example: Interest costs Explicit: borrow $100K at 5% interest with a cash cost of $5K Explicit: borrow $60K at 5% interest with a cash cost of $3K Implicit: borrow $40K from yourself at an implicit 5% cost for $2K Costs are the case in two examples = $5K Profits: Accounting profit = revenues less explicit costs Economic profit = revenues less explicit and implicit costs Economic profit usually lower than accounting profit 4
The production function The production function shows the relationship between inputs and outputs-specifically the quantity of inputs needed to produce a quantity of output Can be displayed as an equation, table or graph Best-known (macro) production function is Cobb-Douglas Y = AF(K,L), where Y – output. L – labor, K – capital, and A is unexplained residual The residual is the amount of output that cannot be attributed to labor or capital, such as the layout of the factory floor 5
Production function: an example L(no. of workers) Q(bushels of wheat) 3,000 2,500 0 0 2,000 1 1000 1,500 Quantity of output 2 1800 1,000 3 2400 500 4 2800 0 0 1 2 3 4 5 5 3000 No. of workers 0
Marginal product In the previous example, hiring the next incremental worker increases output by the marginal product of labor The marginal product of any input is the increase in output arising from the additional unit of that input, holding all other inputs constant ∆ (delta) = “change in…” Examples: ∆Q = change in output, ∆L = change in labor Marginal product of labor (MPL) = ∆Q / ∆L 7
Example: Total and marginal product L(no. of workers) Q(bushels of wheat) 0 0 ∆Q = 1000 ∆L = 1 1 1000 ∆Q = 800 ∆L = 1 2 1800 ∆L = 1 ∆Q = 600 3 2400 ∆Q = 400 ∆L = 1 4 2800 ∆L = 1 ∆Q = 200 5 3000 0 MPL 1000 800 600 400 200
Example: MPL = slope of production function 3,000 2,500 2,000 Quantity of output 1,500 1,000 500 0 0 1 2 3 4 5 No. of workers 0 L(no. of workers) Q(bushels of wheat) MPL MPL equals the slope of the production function. Notice that MPL diminishes as L increases. This explains why the production function gets flatter as L increases. 0 0 1000 1 1000 800 2 1800 600 3 2400 400 4 2800 200 5 3000
Importance of the concept of (diminishing) marginal product Allows the producer to think along the margin and help make the decision to hire another worker or add another input Why does the marginal product of labor decline Additional worker in the agricultural example has less land to cultivate and is hence less productive In general, the more intense use of labor with any fixed input such as capital, land etc mans diminishing MPL So diminishing MP is that the MP of an input declines as the quantity of the input increases (other things equal) 10
Example 1: Costs $1,000 $0 $1,000 $1,000 $2,000 $3,000 $1,000 $4,000 $5,000 $1,000 $6,000 $7,000 $1,000 $8,000 $9,000 $1,000 $10,000 $11,000 0 L(no. of workers) Q(bushels of wheat) Cost of land Cost of labor Total Cost 0 0 1 1000 2 1800 3 2400 4 2800 5 3000
Marginal costs Marginal cost (MC) is the increase in total costs from producing one more unit MC = ∆TC/ ∆Q If marginal cost in less than the incremental revenue obtained, the additional use of the input is not profitable or makes sense. 13
Example 1: Total and marginal cost Q(bushels of wheat) Total Cost 0 $1,000 ∆TC = $2000 ∆Q = 1000 1000 $3,000 ∆TC = $2000 ∆Q = 800 1800 $5,000 ∆TC = $2000 ∆Q = 600 2400 $7,000 ∆TC = $2000 ∆Q = 400 2800 $9,000 ∆TC = $2000 ∆Q = 200 3000 $11,000 Marginal Cost (MC) $2.00 $2.50 $3.33 $5.00 $10.00
Example 1: The marginal cost curve $2.00 $2.50 $3.33 $5.00 $10.00 Q(bushels of wheat) TC MC MC usually rises as Q rises, as in this example. 0 $1,000 1000 $3,000 1800 $5,000 2400 $7,000 2800 $9,000 3000 $11,000
Fixed and variable costs Fixed costs (FC) do not vary with the quantity of output produced Examples: land, capital, loan payment, rent Variable costs (VC) vary with the quantity produced Examples: cost of labor and materials Total cost (TC). TC = FC + VC Marginal cost (MC) is the increase in total costs from producing one more unit MC = ∆TC/ ∆Q If marginal cost in less than the incremental revenue obtained, the additional use of the input is not profitable or makes sense. 16
Example 2: Costs $100 $0 $100 100 70 170 100 120 220 100 160 260 100 210 310 100 280 380 100 380 480 100 520 620 0 $800 FC Q FC VC TC VC $700 TC 0 $600 1 $500 2 Costs $400 3 $300 4 $200 5 $100 6 $0 7 0 1 2 3 4 5 6 7 Q
Example 2: Marginal costs MC = ∆TC ∆Q Recall, Marginal Cost (MC)is the change in total cost from producing one more unit: Q TC MC 0 $100 $70 1 170 50 2 220 40 3 260 Usually, MC rises as Q rises, due to diminishing marginal product. Sometimes (as here), MC falls before rising. (In other examples, MC may be constant.) 50 4 310 70 5 380 100 6 480 140 7 620
Example 2: Average fixed cost n/a $100 50 33.33 25 20 16.67 14.29 0 Average fixed cost (AFC)is fixed cost divided by the quantity of output: AFC = FC/Q Q FC AFC 0 $100 1 100 2 100 3 100 Notice that AFC falls as Q rises: The firm is spreading its fixed costs over a larger and larger number of units. 4 100 5 100 6 100 7 100
Example 2: Average variable cost n/a $70 60 53.33 52.50 56.00 63.33 74.29 0 Average variable cost (AVC)is variable cost divided by the quantity of output: AVC = VC/Q Q VC AVC 0 $0 1 70 2 120 3 160 As Q rises, AVC may fall initially. In most cases, AVC will eventually rise as output rises. 4 210 5 280 6 380 7 520
Example 2: Average total cost (cost per unit, or unit cost) AFC AVC n/a n/a n/a $170 $100 $70 110 50 60 86.67 33.33 53.33 77.50 25 52.50 76 20 56.00 80 16.67 63.33 88.57 14.29 74.29 0 Average total cost (ATC) equals total cost divided by the quantity of output: ATC = TC/Q Q TC ATC 0 $100 1 170 2 220 3 260 Also, ATC = AFC + AVC 4 310 5 380 6 480 7 620
Example 2: Average total cost $200 $175 $150 $125 Costs $100 $75 $50 $25 $0 0 1 2 3 4 5 6 7 Q 0 Q TC ATC Usually, as in this example, the ATC curve is U-shaped. 0 $100 n/a 1 170 $170 2 220 110 3 260 86.67 4 310 77.50 5 380 76 6 480 80 7 620 88.57
Example 2: The cost curves, ATC, AFC, AVC and MC $200 $175 $150 AFC $125 AVC Costs $100 ATC $75 MC $50 $25 $0 0 1 2 3 4 5 6 7 Q 0
Example 2: Why ATC Is usually u-shaped $200 $175 $150 $125 Costs $100 $75 $50 $25 $0 0 1 2 3 4 5 6 7 Q 0 As Q rises: Initially, falling AFCpulls ATC down. Eventually, rising AVCpulls ATC up. Efficient scale:The quantity that minimizes ATC.
EXAMPLE 2: ATC and MC and profit maximization $200 $175 $150 $125 Costs $100 ATC $75 MC $50 $25 $0 0 1 2 3 4 5 6 7 Q 0 When MC < ATC, ATC is falling. When MC > ATC, ATC is rising. The MC curve crosses the ATC curve at the ATC curve’s minimum.
Costs in the short- and long-run Short-run Some inputs are fixed (land, capital) Long-run: All inputs are variable, as more land can be bought, etc Fixed costs (FC) do not vary with the quaintly of output produced The long-run ATC is a succession of short-run ATC curves. 26
A typical LRATC curve ATC LRATC Q In the real world, factories come in many sizes, each with its own SRATC curve. So a typical LRATC curve looks like this:
ATC Changes as scale of production changes ATC LRATC Q Economies of scale: ATC falls as Q increases. Constant returns to scale: ATC stays the same as Q increases. Diseconomies of scale: ATC rises as Q increases.
ATC and production scale Economies of scale occur when increasing production allows greater specialization. Workers can be more productive focused on a narrow task. More common when quantity supplied is low. Diseconomies of scale develop due to coordination problems in large organizations (stretched management) More common when output supplied is high 29
Summary and conclusion Costs are both explicit (in cash) or implicit (no cash outlay but an opportunity cost). Both are important to the firm’s decision making Accounting profit is revenue less cash outlays; economic profit is revenue less all (explicit and implicit) costs Production function shows relationship between inputs and output. Marginal production is the increase in output coming from one additional input. Labor is the most common example. Marginal product usually diminishes with insensitivity of use. As output rise the production function becomes flatter (the delta declines) and the total cost curve becomes steeper (delta increases) Variable costs vary with output; fixed costs do not Marginal costs is the increase in total cost from an extra (incremental) unit of production,. The MC curve is usually upward sloping. 30
Summary and conclusion Average variable cost is variable costs divided by output Average fixed cost is fixed cost divided by output. AFC always falls as output rises. Average total cost (cost per unit or unit cost) is total costs divided by the quantity of output. ATC curve is usually U-shaped. The MC curve intersects the ATC curve at the minimum average total cost MC < ATC, ATC fall as Q rises MC > ATC, ATC rises as Q In the long-run, all costs are variable Economies of scale: ATC falls as Q rises Diseconomies of scale: ATC rises as Q rises Constant returns to scale: ATC remains the same as Q rises 31