Download
1 / 28
290 likes | 524 Views
ERE7: Renewable Resources. Fisheries Growth rates in biological resources Steady-state harvest Perfect market Open access Dynamic harvesting Policy intervention. Last week. Resources and Reserves Social optimum and a model for a perfectly competitive market Sensitivity analysis

E N D
ERE7: Renewable Resources • Fisheries • Growth rates in biological resources • Steady-state harvest • Perfect market • Open access • Dynamic harvesting • Policy intervention
Last week • Resources and Reserves • Social optimum and a model for a perfectly competitive market • Sensitivity analysis • Increase in interest rate and resource stock • Change in demand and extraction costs • Market failure • Monopoly • Taxes and subsidies • Reality
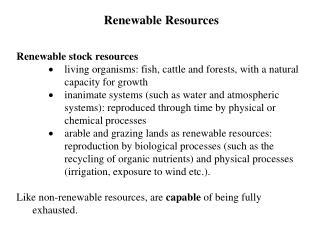
Renewable Resources Renewable flow resources • Such as solar, wave, wind and geothermal energy • These energy flow resources are non-depletable Renewable stock resources • living organisms: fish, cattle and forests, with a natural capacity for growth • inanimate systems (such as water and atmospheric systems): reproduced through time by physical or chemical processes • arable and grazing lands as renewable resources: reproduction by biological processes (such as the recycling of organic nutrients) and physical processes (irrigation, exposure to wind etc.). • They are capable of being fully exhausted.
Catches, 1995-97, cf 85-87 • Sea fish: 73 mln t, +7% • Freshwater fish: 6 mln t, +19% • Mollusc: 11 mln t, +38% • Aquaculture: 34 mln t, +166% (mostly Asia) • Fish provides 16% of animal protein, 6% of total protein
State of world stocks in 1999 Source: Garcia and de Leiva Moreno (2001)
Biological growth processes • Change of population: • g is the intrinsic growth rate (birth rate minus mortality rate) of the population • With an upper bound it becomes: • An example: (simple) logistic growth curve ? or
Logistic growth curve Stock (S) SMAX SMIN SZERO Time
Steady state harvest G, H Rate of change: In steady state: MSY G(S) S0 Smax Stock
Exploitation Effort: Harvest: G, H eE3S eE2S E3> E2 > E1> E0 eE1S h3 h2 h1 eE0S h0 S0 S
Exploitation (2) H E3> E2 > E1> E0 h2 h1 h3 h0 E0 E1 E2 E3 E
Profit Maximisation Total costs: V, C Total revenue: C=wE VProf V-C=MAX V=PH CProf E0 EProf E
Open Access, Steady State Net growth of stock in steady state: Harvest: Cost: Revenue: For open access: Equilibria: and
HProf Costs HOA EOA Emax EProf E Profit maximisation and open access equilibrium Revenue
Open access vs Restricted access fisheries • Consequences of open access: entry continues until all rents are dissipated (profit per boat = zero). • Stock sizes will tend to be lower, and harvest rates will tend to be higher (but may not always be) compared with a restricted access fishery. • Extinction is more likely, but will not necessarily happen.
Introducing time Objective function: Equations of motion: Hamiltonian: Necessary conditions: Social optimum is market outcome iff:
Profit maximisation and stock effect (1) and In steady state: Fundamental equation: Stock effects if: Add units to the stock if: Harvest additional units if:
Profit maximisation and stock effect (2) • If harvesting costs do not depend on stock size: • If harvesting costs depend on stock size: • For a given i: • Stock size is higher • dG/dS is lower since (dC/dS)/p is negative • i> dG/dS
G(S) Slope = i Slope = i - [-(C/S)/P] SPV SPV* S Harvest Costs and Stock Effect
Sum up • Equilibrium conditions: • Dynamic • Static • Static profit maximisation equilibrium only if i=0 • Open access equilibrium is independent of discount rate
Fisheries • If H>G, fish stocks fall, perhaps to (local) extinction • Reasons • Open access, little incentive to preserve • It may be profitable ... • Ignorance and uncertainty • Variability, shocks, disturbances • Contributing factors • High market price, high elasticity • Low harvesting costs • Low stock growth • High discount rate
Renewable Resource Policy • End open access • Information • Create forward or future markets • Taxes • Tradeable permits • Technical restrictions • Time restrictions
Fishery Policy in the EU • Early 1970s first common fishery policy (CFP) • Equal access to waters of the member states to all EU fisherman • Principal instrument: species-specific total allowable catch (TAC) • Set annually based on scientific advise • Divided into quotas • Discarding and black fish make TAC difficult to determine
Why did the CFP fail? • Principle of equal access is not shared by the fisherman • Political interference with the TAC to protect fisherman • Centralised structures • Fishing fleet is far too large • „Flag“ ships • Tension between support for ship building industry and economic efficiency
What could be done? • Individual tradable quotas • A large number of fisherman will exist the industry • Does nothing to stop cheating • Political interference • Might lead to buy out • Vessel licensing • No pretence for monitoring • Difficult to determine total killing power • Conflicts with social objectives • Abandoning the principle of equal access