Download
1 / 30
300 likes | 475 Views
Living Stander: Incomes, Inequality, and poverty. 學生 : 碩二 歐婉如 9642035 碩二 謝皇儀 9642009. Living Stander: Incomes, Inequality, and poverty. 學生 : 碩二 歐婉如 9642035 碩二 謝皇儀 9642009. 9.1 Income Growth 9.2 Poverty 9.2.1 Rural Poverty 9.2.1.1 Official Poverty Line

E N D
Living Stander: Incomes, Inequality, and poverty 學生: 碩二 歐婉如 9642035 碩二 謝皇儀 9642009
Living Stander: Incomes, Inequality, and poverty 學生: 碩二 歐婉如 9642035 碩二 謝皇儀 9642009
9.1 Income Growth • 9.2 Poverty 9.2.1 Rural Poverty 9.2.1.1 Official Poverty Line 9.2.1.2 World Bank Internationally Comparable Poverty Line 9.2.1.3 Explaining Poverty Trends 9.2.2 Urban Poverty 9.2.3 Overall Poverty • 9.3 Inequality 9.3.1 Accounting for all Income Sources • 9.4 Physical Quality of Indicators 9.4.1 Life Expectancy at Birth 9.4.2 Other Health-Related Indicators 9.4.3 Education 9.4.4 Human Development Index • 9.5 Income, GDP Per Capita, and Purchasing Power Parity Once Again • 9.6 Conclusion
9.1 Income Growth • Growth of household income, convert in 2004 CPI • Three periods : 1991-2004 1985-1991 1978-1985
Shoddy rural CPI • Other limitations to the official data 1.migrants and others with intermediate status are not covered 2.different measurement • Affections: limit comparability ; overstate
9.2 Poverty9.2.1 Rural Poverty 9.2.1.1 Official Poverty Line • 1978 250 million 1985 125 million 2004 26 million • Poverty is fundamentally a rural phenomenon
9.2.1.2 World Bank Internationally Comparable Poverty Line • 2002 poverty line : Ravallion and Chen : 850 RMB per person Chinese standard : 627 RMB per person poverty : 3.2% 12.5% 29million 114millioin
9.2.1.3 Explaining Poverty Trends In early 1980s : • The term of trade of agriculture 1.price 2.modern inputs 3.dissolution of collectives After the mid-1980s • Leading Group for Poverty Reduction in 1986
After the mid-1980s • Leading Group for Poverty Reduction 1.Geographic targeting of designated poor counties 2.Appraisals 3.Government funding 4.the designation dose raise economic growth in poor counties by around 1% annually
During 1993-1996 • marketization of rural procurement and government provided support prices for farmers • nonfarm rural employment and migration
Since 1996 • growth was highly concentrated in urban coastal areas • Farm prices fell in the late 1990s • Urban reforms created urban unemployment and increasing labor-market competition • Fiscal system Since 2000 • Western Development Program : infrastructure investment
9.2.2 Urban Poverty • Ravallion and Chen : in 2002 , the cost of living in the city was 41% higher than in the countryside ; poverty line 1,200 yuan per person per year in the city 0.5% of the urban population was in poverty in 2001 their sample covered permanent urban residents only
9.2.3 Overall Poverty • Ravallion and Chen find that 8% of China’s total population was in poverty in 2001 ,down form 22% in 1991 • Decline in rural poverty – 11% urbanization – 3% the reduction in poverty in urban areas – <0.5%
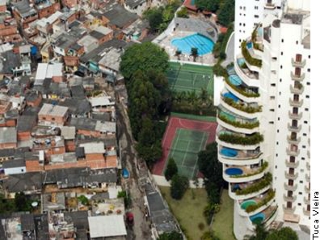
9.3 Inequality • Egalitarian • Gini coefficient • The unusual phenomenon • Simon Kuznets (1995)
Inequality in urban area : 1.capital 2.market distortion • Inequality in rural area : 1.TVEs 2.individual entrepreneurship
Figure 9.2 evolution of Gini coefficient 0.447 0.33
9.3.1 Accounting for all Income Sources • 透過學者、中國社會科學學會(Chinese Academy of Social Sciences )、國家統計局(National Statistical Bureau)規模的合作計算出更大的鄉村和都市居民重要的所得來源,整合基期年數1988 、1995、 2002 代表了中國各省的子樣本。 • Khan 、 Riskin (KR)和 Chen、Ravallion(CR) 的比較。Figure9.2 • 數據計算上可能有不同,但不同方法皆得到所得不均提高的結果。
9.4 (9.4.1-9.4.3) Physical Quality of Life Indicators • 由美國海外開發委員會提出的,於1977年作為測量貧困地區居民的生活質量指數,屬於一種綜合指標 。 • 以瑞典為基準的綜合指數
主要由三種指標所構成 1. 預期壽命 – 9.4.1 Life Expectancy at Birth 2. 健康相關的指標: 嬰兒死亡率(Infant mortality) 自然死亡率(Nature of mortality) – 9.4.2 Other Health-Related Indicator 3. 教育(如識字率) : Basic needs -9.4.3 Education
PQLI的特色 : • 這三個指標都是社會普遍關心的問題,是“需要” (Basic needs) 的基本構成要素 • 每個指標都是很好的綜合指數,反映了社會在滿足基本需要方面的許多特徵,是社會發展成就的綜合體現; • 有廣泛的國際可比性 • PQLI是識字率指數、嬰兒死亡率指數和預期壽命指數三者的算術平均值,計算簡單,易於理解 。
PQLI的缺點: • 沒有反映一個國家全部的社會福利。 • 只反映健康狀況的有兩個指標,這實際上是賦予健康指標以雙倍的權重。 • 這可能適用於最貧窮的國家,對富國更缺乏敏感性 • PQLI只是測度了一個國家社會發展的結果,而未能反映出發展的過程。 參考資料 : 網路 MBA智慧百科 網址: http://wiki.mbalib.com/w/index.php?title=%E7%89%A9%E8%B4%A8%E7%94%9F%E6%B4%BB%E8%B4%A8%E9%87%8F%E6%8C%87%E6%95%B0&variant=zh-tw
9.4.4 Human Development Index • 聯合國開發計畫署(United Nations Development Program-UNDP),自1990年起定期編製發佈的HDI (人類發展指數) 國際比較報告 • 壽命、知識(成人識字率與粗在學率-學生註冊人數),及生活水準(依購買力平價計算平均每人國民生產毛額)等三個領域統計數值,用以衡量一國整體的發展概況。 • 同時衡量了人民的健康、教育情況和經濟表現
人類發展指數介乎於0至1之間,可分為: 高度人類發展地區:人類發展指數在0.8或以上 中度人類發展地區:人類發展指數在0.5至0.799 低度人類發展地區:人類發展指數在0.5以下 參考資料: Quality Taiwan 中文品質百科 網址http://qualitytaiwan.atwiki.com/page/Human%20Development%20Index,%20HDI%20%E4%BA%BA%E9%A1%9E%E7%99%BC%E5%B1%95%E6%8C%87%E6%95%B8%20The%20Quality%20of%20Life
Table 9.3 沿海 西部
9.5 Income, GDP Per Capita, and Purchasing Power Parity Once Again • 檢測PPP GDP per capita 與 ordinary GDP per capita • 以PPP計算出的GDP可以用來和其他國家比較,除去相對物價的問題 • 表9.3—比較人均GDP(以PPP計算)和人均GDP(以市場匯率)及兩個相除的比率
較窮困的國家PPP算出來的人均GDP會比用Exchange rate算出的人均GDP高很多 • 窮困的國家中有大量充足的非技術勞務人口與財貨,屬於非交易財。 • 中國的非交易財很多,且價格又特別的低,例如 都市的房子 健康保險 基本的食物產品,這都降低了他們的生活成本,,因此計算出PPP GDP會較高。
9.6 Conclusion • 沒有任何一種單一的指標可以告訴我們在中國的經濟成長有多少,但是我們可以藉由許多指標的組合來描繪出中國,對於其他發展中國家的情況。 • 提升生活品質 提高教育素質 提升健康水準,以迎接下一階段的經濟成長。