Download
1 / 34
340 likes | 422 Views
Explore the world of cluster analysis with Dr. Brad Morantz to uncover patterns and relationships in your data. Learn about the types, methods, interpretation, and applications of cluster analysis, and see real-life examples. Understand why cluster analysis matters for data-driven decision-making.

E N D
Automated Cluster Description in N-Space Or Don't Ask What You Can Tell Your Data but rather What Can Your Data Tell You by Dr Brad Morantz
Why do I care? Definition of cluster analysis Types of cluster analysis What does it tell us? The steps How it is done Interpretation Applications Examples Overview
Why do I Care? • It tells us what is going on in the data • It shows which variables are important • We can see what things “hang around” together • We can see what ranges of data go with which ranges of other data • Exploratory data analysis • This is data driven • No bias from the expert • Not restricted to current theories • Can provide good directions for classifier
Definition • Wikipedia • the partitioning of a data set into subsets (clusters), so that the data in each subset (ideally) share some common trait - often proximity according to some defined distance measure • Maechler, Struyf, & Hubert • Cluster analysis divides a data sets into groups of observations that are similar to each other. • Internet • Identify characteristics that maximally discriminate between groups • Cluster analysis seeks to identify homogeneous subgroups of cases in a population; to identify a set of groups which both minimize within-group variation and maximize between-group variation.
Cluster Analysis • Putting samples into groups so that samples within group are similar and the groups are dissimilar from each other • Grouped around shared values • Data consists of distinct subsets • Cluster to discover them • Sometimes called “class discovery” • Classes not yet defined • Discovered in clustering process • Each group/class is a cluster • No Preconceptions! (Key point!)
Types of Cluster Analysis • Hierarchical • Builds a tree or dendogram • Aglomerative • N clusters of one member each • builds from the bottom up • Divisive • Starts with one big one • Then splits it down • Partitioning • Splits data into groups that are similar • Number of clusters often specified in advance
Methods • Hierarchical • Agglomerative • Nearest Neighbor or minimum method • Join the two that have members that are the closest • Furthest neighbor or maximum method • Join the two that furthest members are the closest • Average or mean-shift • Calculate centroid/medoid of each cluster • Join the two closest • Wards or minimum variance • Join one to cause minimum variance • Divisive • Basically the same only in reverse
Clusters Minimum Maximum Mean is the medoid are observations
Distance Matrix A B C D E F 1 2.5 1 3.2 1.8 1 4.4 2.2 3.7 1 1.7 2.3 2.4 3.6 1 1.9 1.7 2.5 2.1 4.6 1 A B C D E F Every time you join two, those rows and columns are removed and replaced with one row & col for the new cluster
Clustering by Partitioning • Forgy's algorithm • Start with N random seed points • Take each observation and place it in the cluster closest to it. • K-means method • Similar to Forgy's, • Each time a point is added, the cluster medoid is recomputed • Isodata algorithm • Like K means and Forgy's • Adapts and adjusts • Maximum and minimum cluster size • Much more complex
Two Dimensional View Object type 6 observations fall into 2 distinct groups balloon missile bike car Velocity low med high
What is Happening • There is correlation/relationships between variables, things are not just random • Forms groups/clusters that describe a pattern of activity or features
Steps • Plot out in N-Space • a dimension for each variable • Put into clusters • See how many naturally forming clusters • Sort data into its cluster • Analyze data • Go back and remove variables with little effect (kind of like step-wise) • Go to top and do process all over again
Distance • Types of distance • Manhattan • Euclidean • Mahalanobis • Compare distance within to between • Good if cluster is tight and they are far apart • Bad if cluster is big and they are close Good Bad Distance between >> radius Can we tell them apart?
Distance Manhattan Euclidian
Software • SAS, SPSS provides some • I used Kaufmann-Rousseuw and then modified it into matrices for faster operation on newer machines • Originally in Fortran 77 • Then modified it for Fortran 95 • Currently putting it into matrices • for multiprocessing Fortran 2003 • K-R also available for R • Many others available
How it is Done • First use hierarchical aglomerative cluster • Find out how many natural clusters • The data is read into the program • The data starts as N clusters • The two closest clusters/items are made into one • Distances within clusters are calculated • Distances between medoids are calculated • This is continued until there is but one remaining clusters • Separation shows naturally
Natural Clusters Distance Between >> Radius (distance within)
Observe • See how many clusters form naturally • Then go back to partitioning method • Tell it this many clusters • Cluster it into this number of clusters • Or if a-priori data • e.g. • benign or malignant = 2 clusters • hit or miss = 2 clusters • Low, medium, or high = 3 clusters • Then cluster into the number of known groups
Partition Into Clusters • N = the number of clusters is determined • Create N random medoids • Put data into cluster • Using one of the methods described earlier • Some do this a number of times • I found 8 will cover it • Mean shift moves the clusters a little • To find the best clustering
Summary • Hierarchical clustering • Determine number of naturally forming clusters • Cluster into that many clusters • Remove variables as needed • Perform above on an individual cluster if needed • Analysis on each cluster • Removal of variables as needed
Cluster Description • Now we have members of each cluster • Do statistical descriptive analysis by variable • Mean • Median • Variance and standard deviation • Coefficient of variation (CV) • unscaled • Sort variables within cluster by ascending CV • Use this data to modify which variables used • This data tells the story
Example Var mean median sigma CV C 4.5 5 .35 .08 B 2.7 3 .5 .19 A 6.5 7 1.9 .29 E 4.5 5 2.3 .51 D 5.2 5 3.1 .60 The last two variables are swinging all over the place and therefore do not contribute to the definition. (Their value does not help discriminate) The first two have a very tight range to be in this cluster
What Does it Tell Us? • Which variables hang around together • And at what values and ranges • Once a cluster is identified it tells us • What variables in what range are in it • What variables do NOT define this cluster • Which are the most powerful variables • Patterns that create that cluster • What is going on in the data
Example • Breast Cancer data • University of Wisconsin Hospitals • 699 observations • 11 Attributes for each • File number • 9 variables (ordinal scale 1 to 10) • Clump Thickness • Uniformity of Cell Size • Uniformity of Cell Shape • Marginal Adhesion • Single Epithelial Cell Size • Bare Nuclei • Bland Chromatin • Normal Nucleoli • Mitoses • Truth (class: benign or malignant)
Step One • Know that it is benign or malignant • Partition into two groups • Compare results against “truth” • 95% accurate classification • Modify variables used to improve classification accuracy • Found that eight variables gave best accuracy • Slightly better classification rate
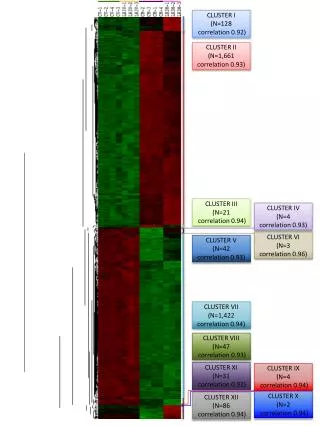
Step Two • Sort out the known malignant observations • Hierarchical cluster them • Seven* natural clusters • Seven situations describing malignancy • Each one tells a story • Each is a set of conditions describing cancer occurrence * work done at last employer so I do not have the data These results are from memory
Step Three • Cluster the malignant cases into 7 clusters • Analyze each cluster • Results: • Defines and describes 7 types of occurrence • The 7 clusters occupy less than 0.1% of the total volume of variable space • This would make for a very powerful classifier • I suspect that the 5% that were misclassified are due to errors in data collection/reporting
Suppose • You had a sensor assembly • That has 50 attributes for output • If tried to use all 50 for pattern recognition • Too computationally intensive • Maybe multicollinearity • Maybe some add more noise than information • Want to get 'best bang for the buck' • Do Exploratory Data Analysis • Cluster analysis • Discriminant analysis • This will tell which variables to use
Applications • Anywhere classification is needed • Better understanding of a data set • Synthetic immune systems • Network intrusion • Identification • Safe operating areas • Data driven knowledge • Classifier with many variables • Identify the most powerful to use
References • Kaufman-Rouseeuw “clusfind” software on CMU stat library • Kaufman & Rousseeuw Book • Statsoft web site on-line stats book • SPSS web site • Multivariate Analysis by Hair et al • Pattern Recognition & Image Analysis by Gose, Johnsonbaugh, & Jost • IEEE explore • KD Nuggets • Wikipedia
Future • This is now a home project • I am working on putting this process into matrices for multiprocessing • More extensive testing
My Work • Cluster Analysis is not my focus • I am a Decision Scientist • I work at methods to make the best possible and most intelligent decisions • Cluster Analysis is one of my tools • It helps me to understand what is going on • I also use other tools: • Neural networks • Statistics (descriptive, inferential, regression, ANOVA, etc) • Genetic Algorithms • Fuzzy logic/ PNL Precisiated Natural Language • Decision Theory • Modeling & Simulation • Data mining