Download
1 / 40
400 likes | 650 Views
Aquifer Water Quality. Groundwater Hydraulics Daene C. McKinney. Introduction. Groundwater Quality Sampling Plan Field Measured Parameters pH Alkalinity Conductance Salinity Dissolved Oxygen Turbidity Chemical Equivalence Laboratory QA/QC Diagrams Piper Stiff

E N D
Aquifer Water Quality Groundwater Hydraulics Daene C. McKinney
Introduction • Groundwater Quality • Sampling Plan • Field Measured Parameters • pH • Alkalinity • Conductance • Salinity • Dissolved Oxygen • Turbidity • Chemical Equivalence • Laboratory QA/QC • Diagrams • Piper • Stiff • Water Quality Classification • Irrigation Water • Sodium • Salinity • Arsenic • Iron Bacteria
Water Quality Management Process • Identify • Problem • Indicators • Target Values • Assess source(s) • Determine linkages • Sources Targets • Allocate permissible loads • Monitor and evaluate • Implement
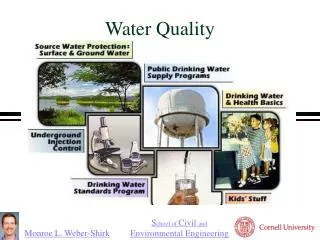
Groundwater Quality • Helps us understand the hydrogeologic system • Indicates comingling of groundwater and surface water • Helps us interpret groundwater flow dynamics • Delineates groundwater contamination
Basic Water Quality Parameters • pH • Specific conductance (EC) • Salinity • Total dissolved solids (TDS) • Turbidity • Dissolved oxygen (DO) • Biochemical oxygen demand (BOD) • Temperature
pH • Measures hydrogen ion concentration • Negative log of hydrogen ion concentration • Ranges from 0 to 14 std. units • pH • 7 neutral • 0 - 7 acidic • 7 - 14 alkaline Thanks to Phil Brown
Solubility of Specific IonsBased on Water pH Toxic metals less available in water at pH 6 to 8.
Conductivity • Measures electric conductivity (EC) of water • Higher value means water is a better electrical conductor • Increases when more salt (e.g., sodium chloride) is dissolved in water • Indirect measure of salinity • Units are μmhos/cm at 25o C or μsiemens/cm Thanks to Phil Brown
Conductivity at Barton Springs • Specific conductance is an indication of the hardness of water. The specific conductance declines in spring water when rainfall enters the aquifer and later discharges in the spring. Below is a graph demonstrating this effect in Barton Springs. Rainfall is indicated in red, and specific conductance in blue.
Salinity Salts in Sea Water • Classification of Ground Water • Composition Based on Total Dissolved Solids Content
Dissolved Oxygen • Amount of gaseous oxygen (O2) dissolved in water • Oxygen gets into water by diffusion from the surrounding air, by aeration, and through photosynthesis • DO range from 0-18 mg/l • Need 5-6 mg/l to support a diverse population • DO < 2 mg/l - Hypoxia Thanks to Phil Brown
Turbidity • Measured in Nephelometric Turbidity Units (NTU) • Estimates light scattering by suspended particles • Photocell set at 90o to the direction of light beam to estimate scattered rather than absorbed light • Good correlation with concentration of particles in water HF Scientific MicroTPI – Turbidity Meter YSI 556 MPS Thanks to Phil Brown
Abundance of Dissolved Constituents in Surface and Ground Water Major Constituents (> 5 mg/L) Ca Mg Na Cl Si SO42- - sulfate H2CO3 - carbonic acid HCO3-- bicarbonate Minor Constituents (0.01-10 mg/L) B K F Sr Fe CO32- - carbonate NO3- - nitrate
Abundance of Dissolved Constituents in Surface and Ground Water Trace Constituents (< 0.1 mg/l) Al As Ba Br Cd Co Cu Pb Mn Ni Se Ag Zn others
Water Classification • How? • Compare ions with ions using chemical equivalence • Making sure anions and cations balance • Use of diagrams and models • Why? • Helps define origin of the water • Indicates residence time in the aquifer • Aids in defining the hydrogeology • Defines suitability
What is Chemical Equivalence? • Chemical analysis of groundwater samples • Concentrations of ions are reported by • weight (mg/L) • chemical equivalence (meq/L) • Takes into account ionic charge • Equivalent Concentration
Formula weight • Formula weight • Multiply atomic weight by # of atoms and add together • E.g., • Formula weight of water H2O = 2*(Atomic Wt of H) + 1*(Atomic Wt of O) 2*(1.008) + 1*(16) = 18.01 Atomic Weight (Relative atomic mass) is a dimensionless physical quantity, the ratio of the average mass of atoms of an element to 1/12 of the mass of an atom of carbon-12
Ion Balance • If all ions are correctly determined by a lab • sum of cationsshould equal sum of anions (all in meq/L) • Errors in analysis and chemical reactions in samples • 5% difference is considered acceptable • > 5%, question the lab results
Calculating Equivalence For instance: The atomic wt. of Sodium (valence of one) = 22.989 And its charge is one Dividing the concentration of sodium in the sample (19 mg/L) by its “combining wt.” = 0.827meq/L or its equivalent concentration.
Use of Diagrams • There numerous types of diagrams on which anions and cations (in Meq/L) can be plotted. These include: • Piper • Stiff • Pie • Schooler • Depth Profile
Stiff Diagrams • Concentrations of cations are plotted to the left of the vertical axis and anions are plotted to the right (meq/L) • The points are connected to form a polygon. • Waters of similar quality have distinctive shapes.
Average Composition of Sea Water and Mississippi River water
Hardness of Water T07_04_02
WELL SAMPLING • Calculate Well Volume: • Determine static water level • Calculate volume of water in the well casing • Purge the well: • A minimum of three casing volumes is recommended.
ANALYSIS OF WATER SAMPLES • Field: • pH, specific conductance, temperature, dissolved oxygen, and alkalinity • Laboratory: • Cations: sodium, calcium magnesium, potassium, and iron • Anions: bicarbonate, carbonate, sulfate, and chloride • Trace Metals, Radioactivity
Sodium and Irrigation • Sodium reacts with soil to reduce permeability. • Alkali soils - High sodium with carbonate • Saline soils – High sodium with chloride or sulphate • Neither support plant growth • Sodium Adsorption Ratio (SAR)
Salinity and irrigation • Low salinity water • used for most crops • Medium salinity water • used with moderate amount of leaching (potatoes, corn, wheat, oats, and alfalfa) • High salinity water • Cannot be used on soils having restricted drainage. • Very high salinity water • Can be used only on certain crops and then only if special practices are followed
Arsenic in Groundwater • Long-term exposure to arsenic from drinking water is directly linked to: • Cancer of the skin, lungs, urinary bladder and kidneys. • Acute gastrointestinal and cardiac damage as well as vascular disorders such as blackfoot disease. • Sub-lethal effects include diabetes, keratosis, heart disease and high blood pressure. • Toxicity is dependent on diet and health, but is cumulative. Arsenic is excreted very slowly by the body through deposition in the hair and nails.
BACKGROUND • Arsenic (As) • toxic metal widespread in groundwater • Occurs widely in aquifers • deltaic sediments near mountain uplift zones • deep sandy aquifer layers originating as riverine, lake or coastal deposits. • Ganges, Mekong and Red River deltas, sandy alluvial deposits in South Asia, South East Asia, South America, and in many parts of North America and Europe.
Arsenic Contamination • Associated with fluctuating water tables and flooding cycles particularly in • Acidic sulfate soils or • Iron and/or manganese-enriched layers, • saline-layered aquifers • Levels in water supplies can vary through a year adding to the difficulties of identification and monitoring.
Drinking Water Standards • Worldwide 50 ppb limit (1942) • US EPA • Acceptable mortality = 1 death per 1,000 people for carcinogens • Lifetime risk from exposure to 50 ppb As • 13 cancer-related deaths per year per 1000 people (1992) • Current standard = 10 ppb standard
Summary • Sampling Plan • Field Measured Parameters • pH • Alkalinity • Conductance • Salinity • Dissolved Oxygen • Turbidity • Chemical Equivalence • Laboratory QA/QC • Diagrams • Piper • Stiff • Water Quality Classification • Irrigation Water • Sodium • Salinity • Arsenic