Download
1 / 1
10 likes | 118 Views
The Upper Layer Response To an Extended Shallow Diversion of a Wasterwater Plume – Where Did All The Nutrients Go? Bridget N. Seegers 1 , Teel, E. N. 1 , Kudela , R.M. 2 , Caron, D.A. 1 , Jones, B.H. 3

E N D
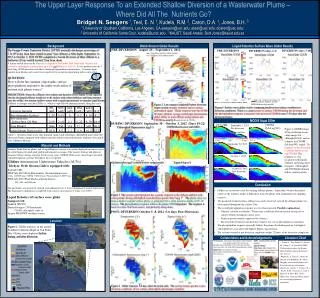
The Upper Layer Response To an Extended Shallow Diversion of a Wasterwater Plume – Where Did All The Nutrients Go? Bridget N. Seegers1, Teel, E. N.1, Kudela, R.M. 2, Caron, D.A. 1, Jones, B.H. 3 1 University of Southern California, Los Angeles, CA seegers@usc.edu, eteel@usc.edu, dcaron@usc.edu; 2 University of California Santa Cruz, kudela@ucsc.edu , 3KAUST, Saudi Arabia, Burt.Jones@kaust.edu.sa Background Webb Slocum Glider Results Liquid Robotics Surface Wave Glider Results PRE-DIVERSION August 29 – September 1, 2012 The Orange County Sanitation District (OCSD) normally discharges an average of 5.3x10⁸ L/day from their outfall located 7 km offshore at 60m depth. September 11, 2012 to October 3, 2012 OCSD completed a 3-week diversion of their effluent to a shallower (20 m) outfall located 2 km from shore. PRE-DIVERSION DIVERSION (days 5-10) DIVERSION (days 1-5) September 2, 2012 Pre-diversion RFUs Outfall Pipes A similar outfall diversion by City of Los Angeles in November 2006 lasted only 50 hours and resulted in chlorophyll concentrations up to 100 μg l-1(Riefel et al 2013). It was predicted that the 3 week long OCSD diversion could have similar phytoplankton concentrations. Concerns about harmful algal blooms and coastal water quality led to an intense monitoring and research effort. Latitude 0.01 m-1 0.1ug L-1 0.5 m-1 September 20, 2012 Longitude QUESTION How will the late summer oligotrophic surface phytoplankton respond to the multi-week influx of nutrient rich plume waters? RFUs October 1, 2012 October 8, 2012 Post-diversion PREDICTIONS: Due to the effluent’s low salinity and therefore lower density it was expected that the discharged effluent would rise to the surface with reduced dilution and bring nutrients into the well-lit, low nutrient shallow waters with a significant potential to stimulate algal blooms. Effluent is nitrogen enriched (Table 1), which is typically the limiting nutrient along the coast. Nearshore shallow outfall Offshore deep outfall RFUs = relative fluorescence units Figure 2. Late summer conditions before diversion began system strongly stratified and no surface chlorophyll signal. Glider transects near the OCSD 60 meter offshore sewage outfall pipe demonstrates glider ability to track effluent using salinity and CDOM as seen by Rogowski et al (2012). Figure adapted from RapheKudela, UCSC Figure 5. Surface wave glider results comparing pre-diversion surface conditions to diversion conditions. There is a clear increase in surface CDOM during the diversion and the phytoplankton response associated with increased CDOM is seen 5 -10 days after the diversion begins. ? MODIS Aqua 250m DURING DIVERSION September 30 – October 3, 2012 (Days 19-22) CDOM QAA ag(443) OC2 CHL CDOM fluorescence (ppb QSE) Chlorophyll fluorescence (μg l-1) Figure 6. MODIS Aqua 250m resolution ocean color images for chlorophyll (left) and an estimate for CDOM, QAAag(443) (right). The response to the diversion is clearly shown in chl and CDOM. The response is very localized with limited offshore and along shore transport. Chlorophyll and CDOM distribution follow similar pattern. Table 1. Nutrients from cruise data found in surface and subsurface chlorophyll max before the diversion began compared with effluent nutrient and the expected nutrients in plume after initial 100:1 diffuser dilution. 1ug L-1 10 ug L-1 0.1 m-1 Material and Methods Teledyne Webb Slocum gliders and a Liquid Robotics surface wave glider deployed on transects near the outfall pipes provided good spatial and temporal coverage of the region’s biology and physical dynamics before, during, and after the diversion event. MODIS 250m ocean color images provided expanded regional coverage throughout the event period. Gliders Autonomous Underwater Vehicles (AUVs) Sigma θ (kg m-3) Chl fluorescence (μg l-1) rotated to show vertical profile Teledyne Webb Slocum Gliders equipped with: • Seabird CTD • WET labs ECO Puck Fluorometer (excitation/emission) • Chl-a (470/695 nm), CDOM (370/460 nm), Phycoerythrin (540/570 nm) • WET labs ECO Puck Backscattering Sensor: • 532, 660, and 880 nm Depth (m) Conclusion Slocum Gliders are recovered, cleaned, and calibrated every 4 weeks throughout 2 month deployment. The fluorometer calibration is completed with a mix of local species (Cetinic et al. 2009). • Gliders are an effective tool for tracking effluent plumes. Especially, because the patchy nature of the response makes it difficult to track the plume with traditional boat sampling transects. • The predicted isolated surface effluent was rarely observed, instead the effluent plume was often mixed throughout the surface 20m. • The overall phytoplankton response was less than expected. Possible explanations: • Dilution “solution to pollution.” Warm water conditions allowed increase mixing of low salinity effluent throughout surface layer. • Plankton growth initially suppressed by effluent. • Bacteria utilized nutrients and therefore response not seen in phytoplankton community. • The phytoplankton response generally follows the plume distribution pattern, but highest chlorophyll not associated with highest plume concentration. • The system returned to pre-diversion conditions within 72 hours of the diversion completion. Figure 3. The system’s phytoplankton has a patchy response to the effluent addition with some patches having chlorophyll concentrations greater than 16 μg l-1. The plume does not form a shallow isolated surface plume as predicted, but is often mixed to depths of 20 -30 meters. The phytoplankton response follows the plume CDOM signature. The response is local, less than 7km from source, and primarily along shore. Liquid Robotics G5 surface wave glider Equipped with: SeaBird GPCTD Turner Designs C3 Fluorometer: CDOM, chlorophyll, crude oil Airmar PB200WX weather station POST- DIVERSION October 5 -8, 2012 (3-6 days Post-Diversion) Photo http://gliders.oceantrack.org/ Location Figure 1. Glider transects in the central Southern California Bight in San Pedro Bay. Gliders were deployed before, during, and after diversion. Collaborators and Acknowledgements Literature Cited • - Cetinic, I., Toro-Farmer, G., Ragan, M., Oberg, C. & Jones B.H.(2009) Calibration procedure for Slocum glider deployed optical instruments. Opt. Express • Rogowski, P., Terril, E., Otero, M. Hazard, L & Middleton, W. (2012) Mapping ocean outfall plumes and their mixing using autonomous underwater vehicles. J. Geophys. Res. • Reifel, K.M., Corcoran, A., Cash C., Shipe, R. & Jones B.H. (2013). Effects of a surfacing effluent plume on a coastal phytoplankton community. OCSD Diversion Nearshore Outfall Newport Beach San Pedro Channel LEGEND GliderNorth GliderSouth GliderOffshore Surface Wave Glider OCSD Outfall Pipes Nearshore (2km) Diversion outfall Offshore (7km) Typical outfall Isobaths 20m 60m 100m Newport Pier Figure 4. Glider transects 3-6 days after diversion ends. The system returns quickly to pre-diversion conditions of low surface chlorophyll and strongly stratified.