Download
1 / 54
540 likes | 655 Views
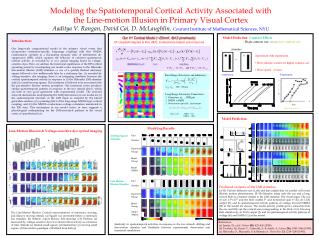
William H. Beasley 1 , Douglas M. Jordan 2 and Stephanie A. Weiss 1 1 University of Oklahoma 2 University of Florida. Two Similar CG Lightning Flashes with Vastly Different Associated IC Activity. Alternative Scholarly-Sounding Titles: A Tale of Two Lightnings or,

E N D
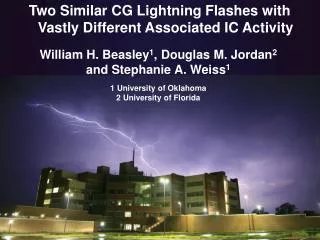
William H. Beasley1, Douglas M. Jordan2 and Stephanie A. Weiss1 1 University of Oklahoma 2 University of Florida Two Similar CG Lightning Flashes with Vastly Different Associated IC Activity
Alternative Scholarly-Sounding Titles: A Tale of Two Lightnings or, On the Varieties of Lightning Experience
Yesterday it became clear that in the context of NWP models, “lightning data” can mean a number of different things, including • NLDN or LLDN ground-strike data • LMA, LDAR or other VHF mapping data • Satellite optical data • WWLN ground-strike data
There was some discussion about what is to be gained by incorporation of lightning data of one kind or another in various models. • There was some discussion about the use of different types or aspects of lightning data.
Lightning data are being used in models as proxy for • Location (and timing?) of convection • Strength of convection inferred from flash frequency, flash density, etc. • Lightning data are being used for • Initialization • Nudging or adjustment, typically by addition of latent heat or adjustment of stability?
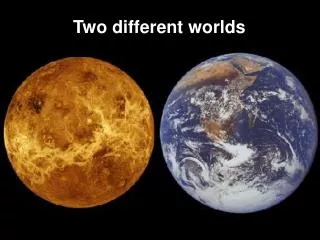
To help inform your judgment about the use of lightning data, I am going to show you that two CG flashes with apparently very similar characteristics can have vastly different associated IC activity that could make a difference in how the lightning is registered by different observing systems.
Further, I ask whether such differences could bear any relationship to differences in the parent storms? • In any case, clearly,
can be quite different manifestations of lightning. For some purposes, it may not matter what you call a flash.
But, if you are going to use lightning characteristics such as flash frequency or flash density to modulate model parameters, then what constitutes a “flash”, as observed by any particular type of observing system, could matter. W.H. Beasley
My Goals for Today • To show you some cool high-speed images • To show you that CG flashes with very similar characteristics can have vastly different associated IC activity • To leave you with a sense of perspective on relation between, and relative scales of, CG and IC portions of lightning discharges
For two CG flashes I will show • Ordinary HDTV Video • NLDN data • High-Speed Images • VHF Source Locations • Radar Reflectivity
NLDN Ground-Strike points and Camera Location at NWC Estimated height of visible CG channel ~ 4 km
HD video, 10:40:15 UT Flash • Ordinary HD camcorder • Two CG Flashes according to NLDN • One at 10:40:15.587 (to left of fov) probably a false positive CG • One of interest at 10:40:15.759
NLDN data @10:40:15 Flash Time lat lon Ipeak est UTC deg deg kA 10:40:15.587 35.1159 -97.4094 +7* 10:40:15.759 35.1665 -97.4800 -6 *false positive CG
High Speed Video • Flash at 10:40:15.759951 • Obtained with Photron SA1.1 • 10,000 frames per second • 0.6665 seconds of data • Stepped Leader in view for ~ 6 ms • Continuing current in view for ~300 ms • ~13 M-components in ~300 ms • HDTV video shows CC lasted >700 ms
VHF LMA data @ 10:40:15 • Standard view using xlma • 3d projection using Google Earth + • Animations using Google Earth + • Animation provided by Ken Cummins and Jean-Yves Lojou
10:40:15 Flash time history Projection of points onto vertical E-W plane Projection of points onto vertical N-S plane 2 5 k m PlanView 40 km
Flash at 05/07/08 1040:15 UTC: XLMA interpretation • initial negative leader moves upward into positive charge • negative breakdown propagates into the horizontal positive storm charge region centered near 9.5 km • as channel develops westward, it slopes downward to 6 km • positive leader propagates horizontally through negative storm charge centered near 4 km. • negative leader to ground starts near 4 km and propagates horizontally for 6 km before turning toward the ground • suggests localized region of positive storm charge near 3.5km just beneath the main negative storm charge. • Other flashes close in space and time to this flash also have negative leaders moving through this positive storm charge • however, most of these other flashes have leaders moving through only this positive charge region and the negative charge region above it. • negative leader to ground is unusual in this case because it seems to involve a third charge region within the same flash. • possible positive polarity breakdown moving along previously conducting negative channels (from the westernmost end of the positive storm charge region back toward the flash initiation point) propagates close enough to the negative storm charge to cause a large enough electric field to initiate a new negative leader.
Animated mapping of VHF sources ~ 5000 VHF source locations for the flash at 10:40:15, displayed in a 3d rendering. Total duration of the flash is just under one second. Total spatial extent is a significant fraction of 100 km.
LMA data overview10:40:15.759951 flash • Nearly 5000 VHF source locations • Just under 1 second duration • No clear gap in activity between IC and CG portions of discharge
HD video, 22:24:27 UT Flash • Ordinary HD camcorder • Two CG Flashes in fov • One at 22:24:27.669 of interest
Another High Speed Video • Trigger at 22:24:27.669368 • Obtained with Photron SA1.1 • 10,000 frames per second • 0.6665 seconds of data • Stepped Leader duration ~ 2.3 ms • Continuing current duration ~12 ms • No M-components
22:24:27 Flash time history Projection of points onto vertical E-W plane 1 2 k m PlanView 4 km 11 km
Similarities and Differences • Stepped Leaders, Branching Similar • Upward-going leaders (attachment) Similar • Return-strokes Similar • Continuing Currents Different • 104015 flash had continuing current of extremely long duration (~700 ms) and numerous M components • 222427 flash had continuing current of ~ 12 ms duration and no M components
How do the Meteorological Situations Compare • Look at Radar Images
Radar and LMA data,10:40:15 flash, CAPPI at ~ 3 km Radar Only Radar with VHF Sources Radar scan ~10:35 - 10:41
Radar and LMA data, 22:24:29 flash, CAPPI at ~ 3 km Radar Only Radar with VHF Sources Radar scan ~22:23 - 22:29
Radar and LMA data comparison 10:40:15 22:24:27
Radar and LMA data comparison 10:40:15 22:24:27
Observations and Comments • There were very few VHF radiation sources determined by the LMA to be co-located and contemporaneous with the stepped leader, return stroke and M components.
There were upward-going leaders before both return strokes • In the last 100 s before rs • approximately 50 meters length.
LMA data during photographically identified M-components suggests • discharge channel in cloud expands in at least two directions more or less simultaneously, • pretty much horizontally as suggested by Krehbiel (1979) and Proctor et al. (1988), but with some vertical extent also,
presumably this shows additional charge sources being tapped to keep cc going. • The continuing current for the 10:40:15 flash lasted more than 700 ms, exceeding the longest previously reported cc duration by about 200 ms (to the best of our knowledge).