Download
1 / 1
10 likes | 136 Views
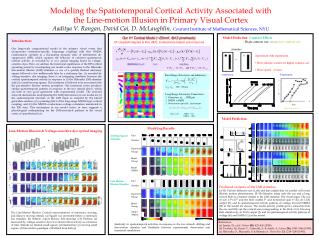
This study presents a large-scale computational model of the primary visual cortex that explores the spatiotemporal activity associated with the Hikosaka line-motion illusion. By employing integrate-and-fire neurons and NMDA conductances, the model captures intermittent de-suppression dynamics synergistic with voltage-sensitive dye imaging. Results highlight remarkable parallels between cortical responses to stationary and moving stimuli, revealing underlying mechanisms involving long-range cortical coupling and NMDA voltage correlation. These findings provide insight into the physiological basis of motion perception in visual processing.

E N D
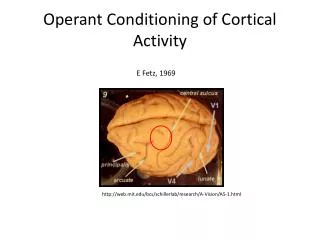
Model Model NMDA NMDA Modeling the Spatiotemporal Cortical Activity Associated with the Line-motion Illusion in Primary Visual Cortex Aaditya V. Rangan, David Cai, D. McLaughlin,Courant Institute of Mathematical Sciences, NYU Model Prediction: Contrast Effects –High contrast cueversuslow contrast cue Our V1 Cortical Model (~25mm2, 8x12 pinwheels) 106 coupled Integrate & Fire (I&F), conductance-based, point neurons Introduction: Our large-scale computational model of the primary visual cortex that incorporates orientation-specific, long-range couplings with slow NMDA conductances operates in a fluctuating dynamic state of intermittent de-suppression (IDS), which captures the behavior of coherent spontaneous cortical activity, as revealed by in vivo optical imaging based on voltage-sensitive dyes. Here, we address the functional significance of the IDS cortical operating points by investigating our model cortex response to the Hikosaka line-motion illusion (LMI) stimulus—a cue of a quickly flashed stationary square followed a few milliseconds later by a stationary bar. As revealed by voltage-sensitive dye imaging, there is an intriguing similarity between the cortical spatiotemporal activity in response to (i) the Hikosaka LMI stimulus and (ii) a small moving square. This similarity is believed to be associated with the pre-attentive illusory motion perception. Our numerical cortex produces similar spatiotemporal patterns in response to the two stimuli above, which are both in very good agreement with experimental results. The essential network mechanisms underpinning the LMI phenomenon in our model are (i) the spatiotemporal structure of the LMI input as sculpted by the lateral geniculate nucleus, (ii) a priming effect of the long-range NMDA-type cortical coupling, and (iii) the NMDA conductance–voltage correlation manifested in the IDS state. This mechanism in our model cortex, in turn, suggests a physiological underpinning for the LMI-associated patterns in the visual cortex of anaesthetized cat. stimulus: • Agreement with experiment: • Wave initiates earlier for higher contrast cue • Wave speed ~0.1m/s vs Spontaneous: FLGN=0 Local Long Range Simulation: Experiment: Short Range (Excitatory and inhibitory): 3 2 1 0 • Long Range, Excitatory Connections: • NMDA +AMPA • Orientation-specific, Anisotropy Time Modified from Ref (a) Time scales: AMPA: ~5ms NMDA: ~80ms Model Prediction: Modeling Results Line-Motion Illusion & Voltage-sensitive dye optical imaging Drifting Square Stimulus Time Stimulus Experiment Voltage Model Voltage Time Line Motion Illusion Stimulus Stimulus Predicted variants of the LMI stimulus. (A–D) Various different cues (Left) and bars (right) that we predict will create illusory motion phenomenon. (E–H) Stimulus using only the cue and a long, curved blob in a manner similar to the LMI stimulus. The visual input. The cue of size 1.5°x1.5° and the blob width1.5° and horizontal span 6° (E), its LGN output (F), and its spatiotemporal activity patterns of voltage (G) and NMDA (H) in the model are shown. The model activity profile grows outwards from the cue and fills out the cortical area corresponding to the blob. (I–L) Growing blob stimulus (I), its LGN output (J), and its spatiotemporal activity patterns of voltage (K) and NMDA (L) in the model. Experiment Voltage Model Voltage The Line-Motion Illusion: Cortical representations of stationary, moving, and illusory moving stimuli. (a) Square cue presented before a stationary bar stimulus. (b) Subjects report illusory line-drawing. (c-f) Patterns (as measured by voltage sensitive dye) of evoked cortical activity as a function of time. Stimuli: (c) flashed small square; (d) flashed bar; (e) moving small square; (f) line-motion paradigm. (Modified from Ref (a)) model experiment References: (a) Jancke, D., et al. Nature 428, 423–426 (2004). (b) Tsodyks, M., Kenet, T., Grinvald, A. & Arieli, A. Science 286, 1943–1946 (1999). (c) Hikosaka, O., Miyauchi, S. & Shimojo, S. Vision Res. 33, 1219–1240 (1993). Similarity in spatiotemporal activities in response to the two stimuli: drifting and line-motion stimulus and Similarity between experimental observation and numerical simulations.