Download
1 / 20
200 likes | 374 Views
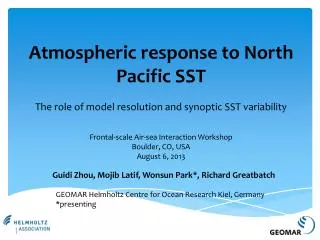
Atmospheric response to North Pacific SST. The role of model resolution and synoptic SST variability. Frontal-scale Air-sea Interaction Workshop Boulder, CO, USA August 6, 2013. Guidi Zhou, Mojib Latif , Wonsun Park*, Richard Greatbatch.

E N D
Atmospheric response to North Pacific SST The role of model resolution and synoptic SST variability Frontal-scale Air-sea Interaction Workshop Boulder, CO, USA August 6, 2013 Guidi Zhou, Mojib Latif, WonsunPark*, Richard Greatbatch GEOMAR Helmholtz Centre for Ocean Research Kiel, Germany *presenting
Outline • Background and motivation • Observed atmospheric response to re-emergent SST • AGCM response • Sensitivity to background SST and horizontal resolution
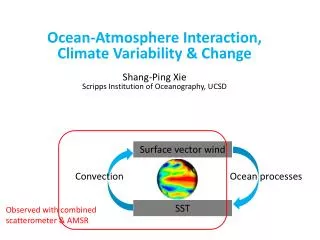
Background and motivation • Extra-tropical SST experiences annual reemergence [Alexander et al. 1999…] • The atmosphere responds to extra-tropical SST anomalies [Czaja & Frankignoul1999, 2002…] • Response is small compare to Tropical response and internal atm. variability [Palmer & Sun 1985; Kushnir et al. 2002…] • But potentially persistent due to the large thermal inertia of the oceanic mixed layer [Kushnir et al. 2002…] • Transient eddies are crucial [Peng & Whitaker 1999…] • Oceanic fronts are important for anchoring the storm-track [Minobe et al. 2008; Taguchi et al. 2009…]
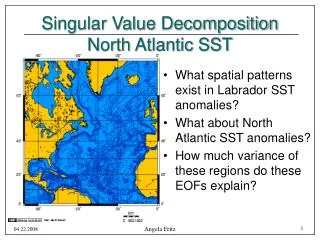
Observed atmospheric link to reemergent SST anomalies • ERSST 80-year winter-mean data • Remove ENSO from NP SST using linear regression (PC1*) • Lagged regression of SST on PC1* (PC1* leads) • SST reemergence found in NP Regressed SST on NP SST PC1* (ENSO removed)
Observed atmospheric link to reemergentSST anomalies • ERSLP 80-year winter-mean data • Remove ENSO from NP SST PC using linear regression (PC1*) • Lagged regression of SLP on PC1* (PC1* leads) • Significant links between SLP and PC1* of previous winters • Deepened Aleutian Low Regressed SLP on NP SST PC1* (ENSO removed)
Observed atmospheric link to reemergentSST anomalies Regressed SST on NP SST PC1* (ENSO removed) Regressed SLP on NP SST PC1* (ENSO removed)
AGCM response to NP SSTa Experimental setup Model: ECHAM5 Resolution: T213 (~0.56°) L31 Background SST: NOAA-OI-Daily SST (time-varying 1981-1990, to preserve the fronts) SST anomaly forcing: +/- lag-0 regression pattern in NP 4-month (NDJF) integrations Initialized Nov.1, +/- 10 winters each Mean (DJF) differences between +/- SSTa experiments studied
AGCM response to NP SSTa SST anomaly (doubled) PDO-like anomaly pattern (K)
The relative position of the SST anomaly with respect to the full SST Positive PDO-like SSTapattern would reduce the front Contour: winter-mean climatological SST (°C) Shading: PDO-like SSTa(°C)
AGCM response to NP SSTa response characteristics Deepened Aleutian Low (hPa)
AGCM response to NP SSTa response characteristics Upward heat fluxes reinforce the SSTain some regions (W/m2)
AGCM response to NP SSTa response characteristics Zonally averaged over NP equiv. barotropic accelerated jet stream deep convection Geopotential height (m) U-velocity (m/s) Vertical velocity (Pa/s)
AGCM response to NP SSTa eddy forcing Consider 40°N (over cold SSTa) conv. eddy vorticity flux upper div., surface conv. conv. eddy momentum flux div. eddy vorticity flux (1/s2) divergence (1/s) div. eddy zonal momentum flux (m/s2)
AGCM response to NP SSTa T213 Response summary Diagnostics (over cold SSTa) Convergence of eddy vorticity flux is balanced by divergence in circulation, resulting in ascent at mid-levels and low-level convergence. The vortex stretching associated produces the surface low. Convergence of eddy momentum flux reinforces the jet. Consistent with Kushnir et al. 2002... Characteristics • Equivalent barotropic low • Upward heat flux reinforcing the SSTain some regions • Accelerated jet stream • Deep convection • Deep diabaticheating • Enhanced storm-track
High vs. low resolutions T31- response T213- response Geopotential height (m) Geopotential height (m)
Influence of synoptic SST variability Sea surface temperature (K) Snapshot,Jan 01, 1982. Fine spatial/temporal structures on T213 Synoptic SST variability only in NP ctrl, NP SSTa experiments Climatological state, Jan 01 Smoothed spatial/temporal structures on T213 ctrl, NP SSTa experiments
Observed daily varying SST vs. climatological SST as background T213-climatological background SST T213-daily varying North Pacific background SST no significant response significant eddy-mediated response
Summary • North Pacific atmosphere response to underlying SST anomalies in observations • This can be simulated only with higher resolution of AGCM, e.g. T213 • Temporal resolution is also important in this aspect • The response is eddy-mediated In order to obtain a realistic response to midlatitude SST anomalies one needs to resolve the synoptic SST variability. This requires employing sufficiently high horizontal resolution. Guidi Zhou gzhou@geomar.de
Zonal mean SST gradient Zonal (120°E-160°W) mean