Download
1 / 14
150 likes | 258 Views
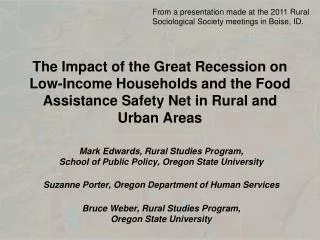
From a presentation made at the 2011 Rural Sociological Society meetings in Boise, ID. The Impact of the Great Recession on Low-Income Households and the Food Assistance Safety Net in Rural and Urban Areas . Mark Edwards, Rural Studies Program, School of Public Policy, Oregon State University

E N D
From a presentation made at the 2011 Rural Sociological Society meetings in Boise, ID. The Impact of the Great Recession on Low-Income Households and the Food Assistance Safety Net in Rural and Urban Areas Mark Edwards, Rural Studies Program, School of Public Policy, Oregon State University Suzanne Porter, Oregon Department of Human Services Bruce Weber, Rural Studies Program, Oregon State University
SNAP use, by county, over time • The following maps show the change in the percentage of working age people and their children (ages 0 to 59) who were receiving SNAP in each Oregon county. • The darker the county becomes over time, the higher the percentage climbs.
Receipt rate: Metro: 10.5% Non-metro: 15.2%
Receipt rate: Metro: 10.3% Non-metro: 15.3%
Receipt rate: Metro: 10.7% Non-metro: 15.8%
Receipt rate: Metro: 12.9% Non-metro: 18.9%
Umatilla Lincoln Wasco Baker Jefferson Linn Lane Malheur Douglas Coos Josephine Klamath Lake Jackson Receipt rate: Metro: 17.2% Non-metro: 23.6%
Time and Place Analysis for Working Poor • The following figures show that among new SNAP cases in 2005, 2008 and 2009, the numbers did not grow dramatically for single mother households, but did grow dramatically for groups that some have called “the new poor” – people who had full year jobs and families with two adults. • They also show that rural areas were hit first and worst, but then urban areas caught up during the height of the great recession.
For more information, contact:Mark Edwards medwards@oregonstate.edu Sue Porter sue.porter@state.or.us Bruce Weber bruce.weber@oregonstate.edu