Download
1 / 47
470 likes | 495 Views
Journey of Indian Agriculture: 1947 to 2005 (6). DESIGN OF PRESENTATION. What agriculture means in 1947. Institutional development in agriculture. Area growth and crop pattern. Production and area. Production and Fertilizer consumption. Development of horticulture.

E N D
DESIGN OF PRESENTATION • What agriculture means in 1947. • Institutional development in agriculture. • Area growth and crop pattern. • Production and area. • Production and Fertilizer consumption. • Development of horticulture. • Development of livestock. • Fishery scenario. • Present status. • Future aspects. • Conclusion.
AT 1947 AGRICULTURAL PRODUCT Under agricultural produce, the following categories of produce have been demarcated: • Fruits, vegetables and products . • Poultry and poultry products ,Dairy products ,meat products. • Honey, jaggery and sugar products, Cocoa products • Alcoholic and non-alcoholic beverages. • Groundnuts, peanuts and walnuts Pickles and chutneys • Horticultural and floricultural products Herbal and medicinal plants • Guar and gum
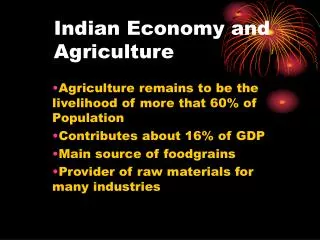
Agriculture is the main stay of the Indian economy. • Agriculture and the allied sectors contribute nearly 23-24% of the GDP • It is monsoon dependent, the year of 2003-04, was blessed with a favourable monsoon and thus the production of food grains touched 212.05 million tonnes • (60 % of the total cultivated area is still dependent on agriculture) • Agriculture is the vital source for economic assistance and all round progress of our country
Present agriculture has taken shape of a business enterprise, which requires a contingent land use and and fullest use of available input resources • Availability of scientific informations about the latest technology and their effective transfer from scientist’s venue to farmer’s field is of utmost importance
Natural resource management under the various five year plans • Soil and water conservation measures were launched in the very first plan • The centrally sponsored scheme of soil conservation in he catchments of the river valley projects (RVP) was started in the third five year plan • A scheme targeting the flood prone rivers was started in the sixth five year plan (due to extensive flood damage of 1978) • The centrally sponsored scheme for reclaimation of the alkali soil was launched in the seventh five year plan for the states of Punjab, Haryana,and UP
In the eighth five year plan the scheme was extended to Gujarat, MP and Rajasthan • The eighth plan also covered the seven north eastern states in the form of WDPSCA • The ninth plan covered the rest of India • (Watershed development project in shifting cultivation areas) • A national watershed development project was launched in 1990-91, in 25 states and 2 UT’s
Fertilizer use scenario in India • India is the third largest producer and consumer of fertilizers in the world after China and USA • The nutrient consumption (purely N P & K) was 17.47 million tonnes in 2003-04 • All India average fertilizer consumption is 92.1 kg per hectare( however there is a wide variation among the states… • Punjab- 181 kg • Haryana-167 kg • Arunachal Pradesh < 10 kg Government initiatives have decreased the rate of application of the nitrogenous fertilizers and thus the ratio of NPK has improved from 7.0:2.7:1(2001) to 6.5:2.5:1(2004)
In the next few slides we are going to prove that technological intervention is of prime importance in the increase of food grain production inIndia
The rice crop has shown an increase of around 3.8 times whereas the wheat crop has shown an increase of 10 times • Reasons for this wide disparity: • Import of improved seeds from CIMMYT, Mexico • The productivity of various wheat hybrids and varieties proved to be immensely successful in the Indian conditions • Rice hybrids are yet to be introduced • In the course of time the wheat crop was started to be taken up in the non traditional areas like West Bengal, unlike rice
To study the increase in the area of cultivation • Initial increase of area from 1950’s to 1970’s • Decrease of area from 1980’s to 1990’s • Eventual plateauing from 1991 to 2002
Studying the decade wise increase in fertilizer consumption • In the third 5 year plan(1961-66), the HYV’S were introduced • Annual fertilizer consumption jumpstarted • Punjab,Haryana and parts of UP, AP,TN, & Maharashtra benefited • Annual food grain production decreased- small & marginal farmers affected most PRODUCTION INCREASEDFROM 82.7(1961-62) MILL TONNES TO 89.36(1964-65), HOWEVER IN 1966 THE PRODUCTION DECREASEDTO 72.36 MILLION TONNES SOURCE: www.agricoop.nic.in
Fertilizer application and its effect on total food grain production. AMOUNT OF FERTILIZER IS NOT THE SOLE DETERMINANT OF FOOD GRAIN PRODUCTION
THE BIGGEST REASON FOR LACK OF CROP DIVERSITY IN INDIA A CASE OF MSP
THE BIGGEST REASON FOR THE LACK OF CROP DIVERSITY IN INDIA--- MSP The MSP for rice, despite the overflowing godowns have increased exponentially over the years. This has provided enough incentive to almost all farmers except a few to take up paddy. This has hampered our crop diversity to a great extent. The MSP for other crops like jowar, bajra, ragi have increased but to a much lesser extent. Result: farmers growing the same water exhausting rice crop year after year, without venturing into other profitable crops like fruits and vegetables
A recent study by Parikh et al. 2003, examined the consequences of the increasing of MSP, of wheat and rice by 10 %. It revealed to have led to a decline in the overall GDP, AND REDUCTION in investments. The increase in agricultural GDP, RESULTING FROM HIGHER GDP, dwindles rapidly and is decreased to a minimum by the third year. Source: Parikh Kirit S., A. Ganesh Kumar, Gangadhar Darbha(2003). “Growth and welfare consequences of rise in MSP” EPW, march
POOR EXPORT: political apathy and lack of infrastructure HOPE: new EXIM policy allows almost all the agri products to be exported freely. Agri imports constitute on an average just about 4.5% of the total imports Agri imports decreased in aggregate terms from US $ 2.8 Billion in 1999-2000 to US$ 2.3 Billion in 2001- 2002 source:
The GREEN REVOLUTION revisited • The green revolution raised productivity levels only in the areas endowed with irrigation and fertile soils • Small farmers were affected adversely • Subsidies targeting the small farmers were misused • “most of the actual expenses ended up paying irrigation department salary and wage payments to a bureaucracy” • source : world bank, 1997 • Irrigation and rural power subsidies distorted cropping patterns and promoted crops that needed lots of water in dry areas
Current scenario On an average three million tonnes of wheat is exported annually from India(2000 ). However there is persistent threat from countries like Australia and Turkey India Exported 2 million tonnes of rice in 2000, however the rice exports are expected to rise very significantly in 2000 AD to 2010 AD. Considering Maize, quantitative restriction on the import of maize flour and 30% custom tariff have posed a brake in the import of maize Cotton(5 lakh bales), spices(2.5 lakh tonnes) ,tobacco and sugar are the items exported Good amount of export in case of mango, apple, banana especially to the U.A.E. Dubai, Sharjah and Abu Dhabi, Sultanate of Oman, Kuwait, Saudi Arabia, Qatar, Bahrain and other Gulf countries, Singapore, Nepal, Srilanka, Malaysia and so on also takes place
Learnings from the above slides There is immense need of improved technology in agriculture( international collaboration, introduction of hybrids and HYV’S) Arranging for alternative sources of irrigation(sprinkler for cereals and drip for high value crops like apples and oranges) Giving more emphasis on the processed goods than the primary agricultural product, to boost export earnings To avoid the ill effects of Green Revolution adoption of LEISA is a necessity today
Vicious circle of MSP TO OVERCOME There must be a gradual decrease in the MSP, to the level of international prices. A low output price will result in more labour than capital being used as input in agriculture, thus leading to market led reforms. This is because the economies of scale will operate in favour of those who have more labour Thus they will start buying land from those who has scarcity of family labour(generally rich farmers)
Remedies that can be brought • Some form of small farm consolidation is required (cooperative farming, contract farming, joint farming) • Out of 100 million farm holdings in India , 80 million holdings have less than 1 hectare of land • Cluster approach can be introduced • Better extension services and improved technology • Smooth and distortion free market access • Increase of farm income by augmenting productivity • Crop diversification
The government should step in to convince the farmers of Haryana and Punjab to go away from the cultivation of rice and wheat • Food processing and value addition to crops is the need of the day( it will also serve to employ more people) In2001, 59% of the total work force in India was engaged in Agriculture, whereas in Aus,Fra,US and UK the figures are 6,7,3 and 2 % respectively. • Integration of farming activities with fisheries, livestock, poultry etc. • Horticulture which is more remunerative can be used to replace agriculture at potential places
DEVELOPMENT IN HORTICULTURE CROP • After a number of revolutions since 1965 – the green revolution (cereals), the white revolution (milk), the blue revolution (fish) and the yellow revolution (oilseeds) – it is now time for a “Golden Revolution” in the horticulture sector. ‘Golden’ because the sector has recorded tremendous achievements in terms of rapid increase in fruit production, foreign exchange, through cutflower exports and employment generation .
Research and Development ActivitiesIN HORTICULTURE SECTOR • The first attempt at systematic horticulture research goes back to 1954 when a separate horticulture sector was created in the division of botany at the Indian Agricultural Research Institute (IARI), New Delhi.. • Establishment of Indian Institute of Horticulture Research (IIHR) at Bangalore in 1968 was another landmark achievement. Institutes such as the Indian Institute of Horticulture Research (IIHR), Bangalore, Central Institute of Sub-tropical Horticulture (CISH), Lucknow, etc., are now engaged in horticulture research • Besides these eight institutes, there are 27 regional stations, one Project Directorate for Vegetable Research (PDVR), Varanasi, 10 national research centres located in different parts of the country working with specific crops like banana, grapes, oilpalm, cashew . • 16 all-India co-ordinated research projects in 223 research centres, one full-fledged university of horticulture, 26 state agriculture universities and 7 multi-disciplinary institutes of ICAR. These are more than adequate research facilities for co-ordinated research on horticulture.
Despite the importance of horticulture in the farm economy, this sector was neglected completely in the first three Plans. The commercial aspects of horticulture were not thought of until the 1970s and the Fourth Plan (1969-74) allocated a modest sum of Rs 34.78 million for this sector. • This was enhanced to Rs 319.56 million in the Seventh Plan (1985-90) and further to Rs 1,047 million in the Eighth Plan (1992-97), when for the first time the sector received a fillip in terms of investment. • In the Ninth Plan, Rs 1,200 million has been allocated for this purpose. Several new and innovative areas such as use of plastic in horticulture, integrated development of tropical, temperate and arid fruits, integrated development of vegetables including tuber crops, commercial floriculture, medicinal and aromatic plants, scheme for cashew development, scheme for spices development, coconut development, post-harvest management, marketing and exports and bee keeping, have been explored
Hi-Tech Horticulture • Hydroponics in horticulture crop production • Organic farming in horticulture • Genetically modified (GM) horticulture crops • Eradicating seasonal inconsistency in production • Ensuring healthy planting material • Protected cultivation • Drip Irrigation for Water Management of Propagation • Micro propagation of plants • Plasticulture for horticulture crop production • Chemicals for improving productivity • A variety of market innovations – the key for development • Cold storage chains and storage facilities • Contract farming for processing units • High density orcharding in fruit crop.
Marwari sheep developwed as carpet wool breed through selection Equine & Camel hair blends with wool CARI-Debendra a dual-purpose breed Sirohi performance improved after selection
Livestock sector in India contributes over 25% to the agricultural sector output, up from 16% in 1970-71. Between 1980-81 and 2003-04, livestock production increased at an annual rate of 4.3%, much faster than the agricultural sector (2.8%) as a whole • Notable growth occurred in dairy and poultry production. Milk production, that had been hovering around 20 million tonnes in 1950s and 1960s, increased to 88 million tonnes in 2003-04. Production of eggs increased from 10 billion in 1980-81 to 40.4 billion in 2003-04 and of poultry meat from 0.1 million tonne to over 1 million tonnes. • Per capita milk consumption nearly doubled from 43 kg to 74 kg and meat consumption increased from 2.4 kg to 3.1 kg between 1983 and 1999-2000.
As of 2003, cattle population in the country was 185 million, 98 million of buffalo, 61 million of sheep, 124 million of Goat, 14 million of Pigs and 489 million of Poultry. • During 1997-2003, the poultry sector in the country registered an annual growth of 7%. • During 2002-04, crossbred cows comprised 10% of total in-milk animals (including dairy goats) and contributed 18% to total milk production. • Total milk production increased by 26 million tonnes, and 37% of this was due to improvement in animal productivity.
FISHERIES • Fisheries sector occupies a very important place in the socio-economic development of the country . • It has been recognized as a powerful income and employment generator as it stimulates growth of a number of subsidiary industries, and is a source of cheap and nutritious food besides being a foreign exchange earner. • The main challenges facing fisheries development in the country includes accurate data on assessment of fishery resources and their potential in terms of fish production, development of sustainable technologies for fin and shell fish culture, yield optimization, harvest and post-harvest operations, landing and berthing facilities for fishing vessels and welfare of fishermen. • There has been significant growth in fish production in the country in the recent years. India is now the third largest producer of fish and second largest producer of fresh water fish in the world.
Fish production during the year 2003-04 was 63.99 lakh tonnes comprising 29.41 lakh tonnes of marine fish and 34.58 lakh tonnes of inland fish. • Fish seed production during 2003-04 was 19231 million fry. • A network of 429 Fish Farmers’ Development Agencies (FFDA’s) has been set up covering all the potential districts in all the States and Union Territories for propagating freshwater aquaculture. • With a view to provide technical, financial and extension support to shrimp farmers in the small scale sector, 39 Brackishwater Fish Farmers Development Agencies (BFDA’s) have been set up in all the coastal States and the UT of Andaman & Nicobar Islands. • Till 2003-04 about 6.49 lakh hectare of water area was brought under scientific fish farming through FFDA’s. • Under the Centrally Sponsored Schemes (CSS) for motorization of traditional crafts a total of about 37,950 have been motorized so far. • Under the CSS for development of infrastructure of marine fisheries the Government of India has sanctioned 6 major fishing harbours, 56 minor fishing harbours and 188 fish landing centres. Out of these, 6 Major Fishing Harbours, 40 Minor Fishing Harbours and 151 Fish Landing Centres have been completed and put to use. The remaining 16 fishing harbours and 37 fish landing centres are at various stages of construction.
PRESENT STATUS IN 2005. • The seeds industry recorded a growth rate of over 20% while pesticide industry showed a downfall of 20%. • Tractor and fertilizer industries registered a growth of 10% each. • The Union Government took many major initiatives - the launch of Rural Infrastructure Project, Rural Employment Guarantee Program, National Horticulture Mission and several other initiatives including revision of seed bill, food bill and Mission 2007. • The subsidy on micro irrigation increased to 50%, agri marketing reforms carried out and commodity trade boosted up. The DIT announced establishing of one lac Village Knowledge Centres in three years time.
India rank first in vegetable production,sugarcane,Milk production. • India rank second in fruit production, fifth in egg production, third in tobacco production. • Many micro and mini project is going on to increase irrigation efficiency and water shed management. • Research in seed development to enhance the productivity of various pulse crop, oil crop, sugarcane and GM crop to meet the future need . • Social forestry is another concept to enhance forest resource . • National Horticulture Board is made to promote horticultural crop production.
CONCLUSION • While area expansion contributed significantly to pre-green revolution growth, gains in agricultural productivity was a major factor for realizing output growth in the post -1965 periods. • Except for wheat, output growth rate could not be maintained despite the adoption of modern agricultural technology. • Although in rice, the productivity picked up a little later, but the extension of area under high yielding varieties did help to boost production of rice after 1980-91. • The growth rate in food grains was, however maintained at a level of 2.2 percent per year mainly because of high growth rate of 5.0 percent in Wheat.
There have been significant shifts in the shares of states in the output of major food grains. For instance, the share of the eastern region of the country (composed of West Bengal, Orissa, Bihar, Assam and the north-eastern) in the total output of rice had declined from 38 percent to 28 percent between the two periods. On the other hand, northern region comprising Punjab, Haryana, and Uttar Pradesh had increased in its share in total output of rice from 10 percent to 23 percent. In the case of wheat, the major locational shift has been from the western region to northern region. • With modern irrigation facility, the agriculture is now moving from rain fed agriculture to sustainable and intensive arena.
Threats and future challenges • The subsidies given by the developed countries to their farmers decrease the prices of agricultural commodities world wide and it kills the market of the poorer countries. • Other countries are always ready to replace India as a leading exporter of various commodities (e.g. : tea in Sri Lanka) • GM seeds, which is the newest craze in agriculture are costly, and the poor farmers may get vanquished in the long run, if proper govt. steps are not taken to safeguard them • There has to be a re think on the policy front to bring down the MSP to rice
The WTO has as its basic principles, on-discrimination, reciprocity, enhanced market access and fair competition among participating countries. The agreement on agriculture has the following four main components: • Concession and commitment on market access • Domestic support and export subsidies • The agreement on sanitary and phyto-sanitary measures ,and • Ministial declaration concerning least developed and under developed countries. • India has to concentrate on phyto-sanitary measure to increase its export and competitor on world scenario.
THANKS PRESENTED BY: ANKAN DAS (8) RAMANUGRAH PANDEY(33).