Download
1 / 55
550 likes | 688 Views
In this presentation for his Ph.D. defense on April 8, 2009, Joshua New explores the pivotal role of visual analytics in deciphering complex relationships within scientific datasets. He highlights the urgent need for advanced tools and methods to help researchers identify meaningful connections, focusing on graph decomposition techniques for multivariate data. The talk covers significant examples from genetics and climate data while outlining the challenges and methodologies necessary for effective data visualization and analytical reasoning in scientific research.

E N D
Visual Analytics for Relationships inScientific Data Joshua New Ph.D. Defense April 8, 2009
IntroductionShort Bio • Education • B.S. double-major Comp. Sci. & Math, Physics minor 2001 • M.S. Computer Systems & Software Design 2004 • Admitted into Ph.D. program at UT 2004 • Granted a research assistantship 2005 with Dr. Huang’s SeeLab • Work experience • Database Administrator (Ft. McClellan, AL) 1997-2001 • GRA at JSU (Jacksonville, AL) 2001-2004 • GRA at UTK (Knoxville, TN) 2005-2009 • Intern at ViTAL Images (Minneapolis, MN) 2006 • Intern at ORNL (Oak Ridge, TN) 200[5,7,8]
IntroductionMotivation • Scientific research now generates many complex, domain-specific datasets. • Extraction and identification of meaningful relationships has become a central problem of scientific research. • Challenges need to be addressed concurrently to provide scientists with the necessary tools, methods, and systems.
IntroductionMotivation • Relationship representation for scientific data • Why Visualization? • Role of Visual Analytics • Science of analytical reasoning facilitated by interactive visual interfaces • Domain-agnostic paradigm
IntroductionOverview • Graph decomposition of multivariate data • How do genes and gene clusters regulate one another? • Optimization framework for linkable pairwise relationships • How do simulation variables interact to cause climate change? • Feature-specific identification of a relationship • What variables constitute a visible phenomenon in a visualization?
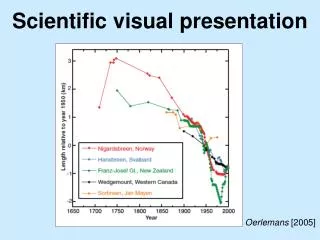
IntroductionDatasets Systems Genetics DataElissaChesler et al., Dr. Langston et al. Climate Data – CLAMPDrake, Erickson and Hoffman Biographical dataMicroarrayCorrelationGenotypesGene ExpressionQTLsMRIPhenotypes Systems GeneticsDatabase IPCC A2 climate simulationYears: 2000-2099 by month256x128 grid; 63 land varsTotal data size: 29GB 7,443 genes cerebellum U74
IntroductionDatasets Jet Combustion DataJackie Chen (SNL); SciDAC Medical DataWhole Brain Atlas, Harvard Turbulent Combustion480x720x120 grid122 timesteps5 variablesTotal data size: 95GB Multiple disease casesBiographical dataCase synopsesMultiple imaging modalities
Sections 1 2 3 Graph Decompositionof Multivariate Data Optimization Frameworkfor Pairwise Relationships Feature-Specific Identificationof a Relationship
Sections 1 2 3 Graph Decompositionof Multivariate Data Scalable Data Servers for Visualization of Large Multivariate Data Feature-Specific Identificationof a Relationship
Graph DecompositionData Structure – Graph • Lower-triangular matrix – O(|V|2) 0 1 2 3 … |V| Matrix[0][0]=NULL Matrix[1] Matrix[3] Matrix[2] 8*|V|2 bytes => |V|2 bytes
Graph DecompositionAlgorithms – Graph Layout • Graph Layout – O(M|V|2) • Parameter Defaults • Graph Layout Spring Equations float ao=1.0471976f, so= 0.1f, ar= 1.0471976f, sr= -1.0f; float grav= 0.1f; int rd=-1, termAbs=-1, termPer=-1, springAlgo= 0; float thresh; intabsValFlag=1, attractFlag=1; Best to Worst (in time): Attract Algo 3/Attract Algo 4; Repulsive Algo 1; Attract Algo 0; RepAlgo2/RepAlgo3/RepAlgo4; Attract Algo 1; Repulse Algo 0; Algo 2:
Graph DecompositionAlgorithms • Graph Layout – O(M|V|2) Algo 2:
Graph DecompositionAlgorithms – Graph Layout • Graph Layout Algorithm Performance
Graph DecompositionAlgorithms – GPGPU Floyd-Warshall– O(|V|3) void floydWarshall(intnumVerts, float** edgeWeights) { inti,j,k; float newDist; for(k=0; k<numVerts; k++) for(i=0; i<numVerts; i++) for(j=0; j<numVerts; j++) { newDist=edgeWeights[i][k]+edgeWeights[k][j]; if(newDist < edgeWeights[i][j]) { edgeWeights[i][j]=newDist; //Add to matrix if want to store a path } } } Radeon HD 4670@$70320procs@750Mhz=240Ghz 8+1=9<10
Graph DecompositionAlgorithms – GPGPU Floyd Warshall’s All Pairs Shortest Path (APSP) averaged over 5 runs: Pentium Xeon 2.0 Ghz, 2GB RAM, WinXP; Quadro FX 1000 (8x300=2.4Ghz) 4/6/09 245x @ $70 AMD Athlon64 2.2Ghz, 2GB RAM, WinXP; 7800GT (20*400=8Ghz)
Graph DecompositionDemo • Demo Considerations: • Size: distance matrix entries much larger than single pixel so we can see; only 32 vertices/columns • Color: the non-vectorized version is shown so that we have sensible gray-scale (higher number mean higher edge weights) • Speed: slowed down so humans can see (every ½ second we try a new intermediate vertex) APSP Demo
Graph DecompositionAlgorithms – Interactive Queries • Compound boolean range query M=3, N=2 (M>N in practice)
Graph DecompositionAlgorithms – Uncertainty • Uncertainty-tolerant object selection • Reproducibility demos/demo3.wel scriptWaitTime 0 Load 0 0.85 featureColors 1 writeKaryo For local0 0 17 1 Increment displayThresh 1 For local1 0 19 1 local4 numQueries Increment local4 -1 For local2 0 local4 1 local3 local0 Increment local3 local0 Increment local3 4 fltQuery local2 local3 0.9999 Increment local3 1 fltQuery local2 local3 0.0001 EndFor
Graph DecompositionVisualization – BTD • Block Tri-Diagonalization (BTD)
Graph DecompositionAlgorithms – LoD Graphs • LoD Graph Construction • Any set of graphs (paracliques, chromosomes, …) become “supernodes” containing as members all vertices of the corresponding graph • Edge set constructed for this vertex set of supernodes using average edge weight between all members of supernode pairs (or vertices) • Supernode stores the ID of its members for training on original data • Quantitative queries remove supernode if all members fail
Graph DecompositionConclusions • Contributions • Parameter settings and spring equations for graph layout algorithms • GPU-accelerated shortest path algorithm • Uncertainty-tolerant learning and scripting systems • BTD overview visualization • Method for constructing hierarchical graphs • Software Artefact: • SeeGraph - http://www.cs.utk.edu/~new/SeeGraph • 12+ LOC, 101 features (readme.txt) • New methods of visualization, interaction, and handles larger data (50,000+ objects) than other packages
Sections 1 2 3 Graph Decompositionof Multivariate Data Optimization Frameworkfor Pairwise Relationships Feature-Specific Identificationof a Relationship
Pairwise RelationshipsMotivation • Multivariate relationships • Parallel Coordinate Plots • Unsolved problem of axis ranking
Pairwise RelationshipsBackground • Graph Analysis (Wegman 1990) • Axis ordering – O(n!) permutations for every adjacency (but redundant) • Graph approach – All vertices adjacent form clique • Apply equation iteratively to cover all permutations 1 5 2 1 5 2 4 3 4 3 1 7 2 6 3 5 4 • Thousands of permutations is intractable! • Need optimality criteria to guide a search
Pairwise RelationshipsBackground • Search Criteria (Peng 2004) • Use clutter calculation between each pair of axes and seek to minimize • Brute force is TSP – find shortest path through n cities • Swap algorithm – swap M times but only if it decreases clutter • Can’t display all parallel coordinate axes • Have to find meaningful subsets of the data
Pairwise RelationshipsApproach • Framework • Allow a user to optimize based on any metric (matrix of numbers) • Correlation • Image analysis of PCP renderings • Data-space clutter detection • Provide mechanisms for constraining search space • Evenly spaced temporal patterns • Patterns among a subset of variables • PCP Axis Layout Algorithms • Brute Force • Heuristic (Greedy, Greedy Pairs) • Graph-based (shortest path)
Pairwise RelationshipsApproach • Search Space • Brute force search for n variables, k axes • n choose k TSP instances • Generalization of TSP – find shortest path through k≤n cities • Brute force for n=63, k=7 in 6.5 days; stopped n=128,k=7 after 3 months • Heuristic Algorithms • Greedy algorithm – find highest edge weight, add highest edge weight connected to either end of the axis layout • Greedy Pairs – get k-1 highest edge weights, permute to find maximum
Graph DecompositionConclusions • Contributions • General framework for matrix definition and restriction • Heuristic algorithms for NP-complete problem • Software Artefacts: • axislayout (added to SeeGraph) • climatize • metrics • seeNC • seeTxt • welify
Sections 1 2 3 Graph Decompositionof Multivariate Data Optimization Frameworkfor Pairwise Relationships Feature-Specific Identificationof a Relationship
Relationship VariablesMotivation • Map relationships to meaningful clusters • Map relationships to individual features if possible • Do this for relationships defined through uncertainty • Let users select items of interest from a visualization
Relationship VariablesApproach • Why Simplified Fuzzy ARTMAP (SFAM)? • Advantages • Online, incremental learning system • Fast and fuzzy • Supervised • Complement-coding • Disadvantages • Vigilance Parameter [0,1] • Sensitivity to the order of inputs • Addressing disadvantages • 3 SFAMs at 0.75, 0.675, and 0.825 • 2 SFAMs at 0.75, different order
Relationship VariablesApproach • Mapping to range queries (approximation with hypercubes) • Data-driven approach
Relationship Variables Conclusions • Contributions • Heterogeneous learning systems for interactive image segmentation • Mapping of categories to compound boolean range queries • Software Artefacts: • ZoomLearn • seePC • pgm2cbrq • nc2aff
Relationship VariablesDemo Learning Demo
Conclusions • Graph decomposition involving novel algorithms and visualization techniques was applied to systems genetics data to find individual genes which coregulate entire clusters of genes. • Linkable pairwise trends was used to establish axis ordering for PCPs and find known as well as novel trends in climate data • Ancillary variables underlying relationships for flame boundaries in physical simulation and tumor detection in medical imagery was quantified in a feature-specific manner
Acknowledgements This work was supported by and used resources of The University of Tennessee, the National Center for Computational Science (NCCS) at Oak Ridge National Laboratory (ORNL), and the Office of Science of the U.S. Department of Energy. This work was supported in part by NSF CNS-0437508, and through DOE SciDAC Institute of Ultra-Scale Visualization under DOE DE-FC02-06ER25778 and by Dr. ElissaChesler and Dr. Michael Langston’s UT/ORNL JDRD 2007. EVEREST PowerWall and lens visualization clusters by NCCS and ORNL’s Visualization Task Group. Systems genetics BXD data was made publicly by R. Williams and colleagues, manicured by Dr. Chesler et al., and processed by Dr. Langston et al. Climate data provided by John Drake, David Erickson, and Forrest Hoffman, from the Carbon-Land Model Intercomparison Project (C-LAMP), partially sponsored by DOE SciDAC and the Climate Change Research Division of the Office of Biological and Environmental Research. Medical imagery from the publicly available Whole Brain Atlas website of Harvard University. Combustion data provided by Jackie Chen from Sandia National Lab and Kwan-Liu Ma as part of the SciDACUltrascale Visualization Institute.
Visual Analytics Techniques forInteractive Exploration of Scientific Data Thank you! Questions?
Publications “Dynamic Visualization of Co-expression in Systems Genetics Data”,Joshua New, Jian Huang, and ElissaChesler, IEEE Transactions in Visualization and Computer Graphics, vol. 14, no. 5, 1081-1094, Sept/Oct, 2008. “Time-Varying Multivariate Visualization for Understanding Terrestrial Biogeochemistry”, Roberto Sisneros, Markus Glatter, Brandon Langley, Jian Huang, Forrest Hoffman, and David Erickson III, Journal of Physics: Conference Series (SciDAC 2008), Seattle, WA, July 2008. To be submitted: “Pairwise Axis Ranking for Parallel Coordinates of Large Multivariate Data.”,Joshua New, Chris Ryan Johnson, and Jian Huang. “Exposing the Black Box: Intuitive Representation of ARTMAP Networks”, Joshua New and Jian Huang, ACM SIGGRAPH Asia and ACM Transactions on Graphics.
Graph DecompositionData Structures - Database • Tree query structure – O(k|V|)
Graph DecompositionAlgorithms – GPGPU • General Purpose computation on the Graphics Processing Units Triangle~3,042 pixelsEach pixelprocessed by a fragment processor each frame(avgshader ~13 lines of code and rarely over 100) Radeon HD 4670@$70320procs@750Mhz=240Ghz
Graph DecompositionAlgorithms – GPGPU • Floyd-Warshall is O(n3) but shader program is O(n) where n=|V| • Copy Distance Matrix to Texture • each pixel corresponds to a normalized distance matrix entry • Render nxn quad in n passes uniform intnumVerts; //passed in from OpenGL program uniform sampler2d data; //distance matrix void main() { int k; vec4 dist_ik, dist_kj, dist_new; //gl_TexCoord set by glTexCoord2f(x,y); for(k=0; k<numVerts; k++) { dist_ik= vec4(texture2D(data, gl_TexCoord[0].i, k/numVerts)); dist_kj = vec4(texture2D(data, k/numVerts, gl_TexCoord[0].j)); dist_new = dist_ik+dist_kj; if( dist_new.x < vec4(texture2D(data,gl_TexCoord[0].i,gl_TexCoord[0].j)).x ) texture2D(data,gl_TexCoord[0].i,gl_TexCoord[1].j)).x=dist_new.x; } } • Note: vec4 distances are elements of 4 floating point numbers (RGBA)