Big Data Visual Analytics: Challenges and Opportunities
420 likes | 679 Views
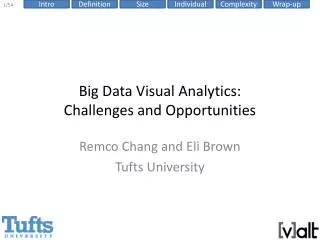
Big Data Visual Analytics: Challenges and Opportunities. Remco Chang and Eli Brown Tufts University. Talk Outline. Visual Analytics + Big Data: What is Big Data Visual Analytics? Definition and Problem Statement How to Visualize Large Amounts of Data ?

Big Data Visual Analytics: Challenges and Opportunities
E N D
Presentation Transcript
Big Data Visual Analytics: Challenges and Opportunities Remco Chang and Eli Brown Tufts University
Talk Outline • Visual Analytics + Big Data: • What is Big Data Visual Analytics? Definition and Problem Statement • How to Visualize Large Amounts of Data? • Tufts Research on Individual Differences • How to Visualize High Dimensional Data?
1. What is Big Data Visual Analytics? A Definition and Problem Statement
Defining Big Data for Visual Analytics • Let’s say that I have a billion data items, is that Big Data? • What if: • These data items only have two attributes (e.g., latitude, longitude)? • If I transpose this dataset such that I have two rows of data, but with a billion attributes?
Defining Big Data for Visual Analytics • Big Data is NOT just about the size of your data • For the purpose of this talk, let’s talk about Big Data in the following way: • Size: The number of rows (n) • Assume the amount of data cannot fit into a desktop computer’s memory • Complexity: The number of attributes (k) • Assume (k > 2)
Problem Statements • Considering the two together is too difficult, so we’ll tackle the two issues independently for now • Our goal is to visualize (large| complex) data sets while: • Maintaining interactivity: rendering at 10 fps • Allowing for operations on the data (zoom, pivot, etc)
Problem Statement Large Data in a Data Warehouse Visualization on a Commodity Hardware
Problem Statement • Constraint: Data is too big to fit into the memory or hard drive of the personal computer • Note: Ignoring various database technologies (OLAP, Column-Store, No-SQL, Array-Based, etc) • Classic Computer Science Problem… • What are some previous techniques? • Truncate (sample, filter) • Resolution reduction (“blurring”, image zooming) • Stream (think Netflix, Hulu) • Pre-fetch (think open world 3D video games)
Pros and Cons: Truncate • Truncate (sample, filter) • Pros: Easy to implement; efficient; scalable • Cons: Sampling is often data- or task-dependent Sampling Algorithm
Pros and Cons: Resolution Reduction • Resolution reduction (“blurring”) • Pros: Allows hierarchical navigations • Cons: • Fine details are often lost, • not all data types can be easily blurred (order-invariant data)
Pros and Cons: Streaming • Stream [Fisher et al. CHI 2012] • Pros: Query can be terminated at any time • Cons: It is inefficient on the database end t = 1 second t = 5 minute Fisher et al. , Trust Me, I'm Partially Right: Incremental Visualization Lets Analysts Explore Large Datasets Faster. CHI 2012
Pros and Cons: Pre-Fetch • Pre-fetch • Pros: Seamless to the user • Cons: Predicting the future is kind of hard • Possible in 3D games because of limited degrees of freedom • http://www.youtube.com/watch?v=n27NLuc44Lk
Pros and Cons: Pre-Fetch • Pre-fetch in Visual Analytics [Chan, Hanrahan, 2008 VAST] • Limit the types of operations a user can do • Allows interactive analysis of over a billion data points Chan et al. ,. Maintaining Interactivity While Exploring Massive Time Series. IEEE VAST 2008
Research at Tufts: User-Centric Pre-Fetching Joint work with Caroline Ziemkiewicz , AlvittaOttley
Individual Differences and Interaction Pattern • Existing research shows that all the following factors affect how someone uses a visualization: • Spatial Ability • Cognitive Workload/Mental Demand • Personality • Experience (novice vs. expert) • Emotional State • Perceptual Speed • … and more
Preliminary Study – Novice v. Expert • Novice vs. Expert financial experts use of the WireVis system when searching for fraud • Novice exhibited “breadth-first-search” behaviors • Experts exhibited “depth-first-search” behaviors • Our next step is to use Machine Learning methods to distinguish a user by analyzing their interactions in real-time
Preliminary Study – Locus of Control • Identified the personality factor, Locus of Control (LOC), as a predictor for how a user interacts with the following visualizations:
Results • When with list view compared to containment view, internal LOC users are: • faster (by 70%) • more accurate (by 34%) • Only for complex (inferential) tasks • The speed improvement is about 2 minutes (116 seconds) R. Chang et al., How Locus of Control Influences Compatibility with Visualization Style, IEEE VAST 2011. R. Chang et al., How Visualization Layout Relates to Locus of Control and Other Personality Factors. TVCG 2012. To Appear.
LOC Priming Performance Good External LOC Average LOC Average ->Internal Internal LOC Poor Visual Form Containment List-View R. Chang et al., Poster: Priming locus of control to affect performance. VAST Poster 2012.
Affective Priming on Visual Judgment R. Chang et al., Influencing Visual Judgment Through Affective Priming, CHI 2013. To Appear
Affective Priming on Visual Judgment R. Chang et al., Influencing Visual Judgment Through Affective Priming, CHI 2013. To Appear
Preliminary Study – Using Brain Sensing (fNIRS) Functional Near-Infrared Spectroscopy • a lightweight brain sensing technique • measures mental demand (working memory) R. Chang et al., Using fNIRS Brain Sensing to Evaluate Information Visualization Interfaces. CHI 2013. To Appear
This is Your Brain on Bar graphs and Pie Charts 3-back test
Quick Summary • Pre-Fetching is a promising approach for supporting interactive visual analysis of large amounts of data • Our “User-Centric” approach is three-pronged: • Understand the user’s cognitive “traits” (e.g., LOC, Numeracy, Spatial Ability, etc.) • Understand the user’s cognitive “states” (Cognitive Load, Affect, etc.) • Alter the user’s behavior by influencing cognitive traits and states through priming
3. How to Visualize Complex (High-Dimensional) Data?
Why is This Problem Hard? You can only see 2D because Your monitor is 2D In other words: you can show at most 2 dimensional data. Everything else is a hack.
Ways to Visualize k-Dimensional Data • Two primary ways to do this “hack” • Divide up the 2D screen into multiple 2D regions • Showing no correlation between dimensions • Showing k-1 correlations • Showing all pair-wise correlations • Project k-Dimensional Data into 2D • 3D to 2D • k-D projection
Ways to Visualize k-Dimensional Data • Divide up the 2D screen into multiple 2D regions • Showing no correlation between dimensions • Showing k-1 correlations • Showing all pair-wise correlations • Project k-Dimensional Data into 2D • 3D to 2D • k-D projection
Ways to Visualize k-Dimensional Data • Divide up the 2D screen into multiple 2D regions • Showing no correlation between dimensions • Showing k-1 correlations • Showing all pair-wise correlations • Project k-Dimensional Data into 2D • 3D to 2D • k-D projection Parallel Coordinates
Ways to Visualize k-Dimensional Data • Divide up the 2D screen into multiple 2D regions • Showing no correlation between dimensions • Showing k-1 correlations • Showing all pair-wise correlations • Project k-Dimensional Data into 2D • 3D to 2D • k-D projection Scatterplot Matrix
Ways to Visualize k-Dimensional Data • Divide up the 2D screen into multiple 2D regions • Showing no correlation between dimensions • Showing k-1 correlations • Showing all pair-wise correlations • Project k-Dimensional Data into 2D • 3D to 2D • k-D projection
Ways to Visualize k-Dimensional Data • Divide up the 2D screen into multiple 2D regions • Showing no correlation between dimensions • Showing k-1 correlations • Showing all pair-wise correlations • Project k-Dimensional Data into 2D • 3D to 2D • k-D projection
Ways to Visualize k-Dimensional Data • Divide up the 2D screen into multiple 2D regions • Showing no correlation between dimensions • Showing k-1 correlations • Showing all pair-wise correlations • Project k-Dimensional Data into 2D • 3D to 2D • k-D projection • Example Projection Methods: • (Dimension Reduction) • PCA • MDS • LDA • LLE • Many others! Usually, try to preserve distances in 2D as they exist in k-D
What We Have Done (at Tufts) • We like projection methods because it is more scalable than the “divide the screen” methods • iPCA – does interaction help understanding high dimensional data? • Demo • Dis-Function – are interactions in 2D meaningful (recoverable) in k-D? • Switch to Eli
Summary • Visual Analytics + Big Data: • Definition of Big Data Visual Analytics • (Large | Complex) Data Analysis • How to Visualize Large Amounts Data? • Pre-Fetching using individual differences and priming • How to Visualize High Dimensional Data? • nDto 2D Projection • Translating interactions from 2D to nD