Download
1 / 60
690 likes | 1.02k Views
010. Marine Ecology. Ecology. Ecology = the study of the interaction of organisms with their environments. Ecology. It involves understanding biotic and abiotic factors influencing the distribution and abundance of living things. Biotic & Abiotic Factors. Biotic Factors Competitors

E N D
010 Marine Ecology
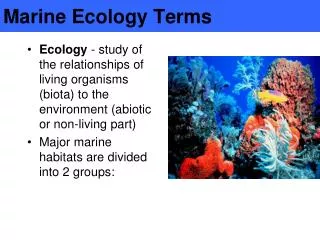
Ecology Ecology = the study of the interaction of organisms with their environments.
Ecology It involves understanding biotic and abiotic factors influencing the distribution and abundance of living things.
Biotic & Abiotic Factors • Biotic Factors • Competitors • Disease • Predators • Food availability • Habitat availability • Symbiotic relationships • Abiotic Factors • pH • Temperature • Weather conditions • Water availability • Chemical composition of environment • nitrates, phosphates, ammonia, O2, pollution
Ecology The word "ecology" coined from Greek word "oikos", which means "house" or "place to live”.
The Scope of Ecology • population growth • competition between species • symbiotic relationships • trophic (=feeding) relationships • origin of biological diversity • interaction with the physical environment
Food Chains • Artificial devices to illustrate energy flow from one trophic level to another • Trophic Levels: groups of organisms that obtain their energy in a similar manner
Food Chains • Total number of levels in a food chain depends upon locality and number of species • Highest trophic levels occupied by adult animals with no predators of their own • Secondary Production: total amount of biomass produced in all higher trophic levels
Nutrients • Inorganic nutrients incorporated into cells during photosynthesis • - e.g. N, P, C, S • Cyclic flow in food chains • Decomposers release inorganic forms that become available to autotrophs again
Energy • Non-cyclic, unidirectional flow • Losses at each transfer from one trophic level to another • - Losses as heat from respiration • - Inefficiencies in processing • Total energy declines from one transfer to another • - Limits number of trophic levels
Energy Flow through an Ecosystem sun Food Chain Primary Producer Primary Consumer Secondary Consumer Tertiary Consumer zooplankton larval fish phytoplankton fish heat heat heat water Nutrients fungi Decomposer
Transfer Efficiencies • Efficiency of energy transfer called transfer efficiency • Units are energy or biomass Pt = annual production at level t Pt-1 = annual production at t-1 Et = Pt Pt-1
Transfer Efficiency Example • Net primary production = 150 g C/m2/yr • Herbivorous copepod production = 25 g C/m2/yr =Pcopepods Et = Pt Pt-1 = 25 = 0.17 Pphytoplankton 150 • Typical transfer efficiency ranges • *Level 1-2 ~20% • *Levels 2-3, …: ~10%
Energy & Biomass Pyramids 10% efficiency Tertiary consumers 10 J 2nd order carnivores Secondary consumers 100 J 1st order carnivores Primary consumers 1,000 J Deposit feeders, filter feeders, grazers Primary producers 10,000 J algae, seagrass, cyanobacteria, phytoplankton 1,000,000 J sunlight
Cellular Respiration Feces Growth Energy Use By An Herbivore
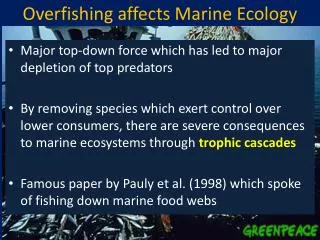
Food Webs • Food chains don’t exist in real ecosystems • Almost all organisms are eaten by more than one predator • Food webs reflect these multiple and shifting interactions
Some Feeding Types Many species don’t fit into convenient categories • Algal Grazers and Browsers • Suspension Feeding • Filter Feeding • Deposit Feeding • Benthic Animal Predators • Plankton Pickers • Corallivores • Piscivores • Omnivores • Detritivores • Scavengers • Parasites • Cannibals • Ontogenetic dietary shifts
Recycling: The Microbial Loop • All organisms leak and excrete dissolved organic carbon (DOC) • Bacteria can utilize DOC • Bacteria abundant in the euphotic zone (~5 million/ml) • Numbers controlled by grazing due to nanoplankton • Increases food web efficiency
Microbial Loop Solar Energy Phytoplankton Herbivores CO2 nutrients Planktivores DOC Piscivores Bacteria Nanoplankton (protozoans)
Keystone Species A species whose presence in the community exerts a significant influence on the structure of that community.
Keystone predator hypothesis - predation by certain keystone predators is important in maintaining community diversity.
Keystone Species Kelp Forests
Keystone Species Algal turf farming by the Pacific Gregory (Stegastes fasciolatus)
An Ecological Mystery • Long-term study of sea otter populations along the Aleutians and Western Alaska • 1970s: sea otter populations healthy and expanding • 1990s: some populations of sea otters were declining • Possibly due to migration rather than mortality • 1993: 800km area in Aleutians surveyed • - Sea otter population reduced by 50%
Vanishing Sea Otters • 1997: surveys repeated • Sea otter populations had declines by 90% • - 1970: ~53,000 sea otters in survey area • - 1997: ~6,000 sea otters • Why? • - Reproductive failure? • - Starvation, pollution disease?
Cause of the Decline • 1991: one researcher observed an orca eating a sea otter • Sea lions and seals are normal prey for orcas • Clam Lagoon inaccessible to orcas- no decline • Decline in usual prey led to a switch to sea otters • As few as 4 orcas feeding on otters could account on the impact • - Single orca could consume 1,825 otters/year
Ecological Succession The progressive change in the species composition of an ecosystem.
New Bare Substrate Colonizing Stage Successionist Stage Climax Stage Ecological Succession
2 types of succession SECONDARY PRIMARY • Growth occurring after a disturbance changes a community without removing the soil • Growth occurs on newly exposed surfaces where no soil exists • Ex. Surfaces of volcanic eruptions
Primary Succession For example, new land created by a volcanic eruption is colonized by various living organisms
Secondary Succession Disturbances responsible can include cleared and plowed land, burned woodlands
Mount St. Helens prior 1980
Mount St. Helens Sep. 24, 1980 May 18, 1980
Mount St. Helens Fireweed 1980 after eruption 2004 2012
Succession after Volcanic Eruption What organisms would appear first? How do organisms arrive, i.e., methods for dispersal? Volcanic eruption creates sterile environment Hanauma Bay Tuff Ring (shield volcano)
Early species improve habitat. Ex. Early marine colonists provide a substrate conducive for settling of later arriving species. First arrivals take precedence. Competition for space, nutrients and light; allopathic chemicals. As resources become scarce due to depletion and competition, species capable of tolerating the lowest resource levels will survive. Mechanisms of Succession Facilitation Inhibition Tolerance
high reproductive output high growth rate short life span low competitive ability low reproductive output higher maternal investment per offspring high competitive ability long life span slow growth rate r & K Selected Species Pioneer species- 1st species to colonize a newly disturbed area r selected r & K refer to parameters in logistic growth equation Late successional species K selected
Successional Models and their Impacts • Case 1: No Disturbance (Competitive Exclusion Model) • Case 2: Occasional Strong Disturbance (Intermediate Disturbance Model) • Case 3: Constant Strong Disturbance (Colonial Model)
Case 1: No Disturbance (Competitive Exclusion Model) • As the reef becomes complex, organisms • compete for space. • Dominant organism outcompetes other • species. • Occurs in stable environments. • Results in low species diversity. • Highly protected patch reefs within • lagoons or protected bays • Deeper water
Case 2: Occasional Strong Disturbance (Intermediate Disturbance Model) • Storms and hurricanes allow for other species to move in • Dominant species would not be allowed to reach competitive exclusion • After each disturbance have a recovery period • Area of high diversity
Case 3: Constant Strong Disturbance (Colonial Model) • Constant exposure to disturbance • Shallow environment • High turnover of species • r-selected species