Download
1 / 35
350 likes | 526 Views
Nitrogen fixing trees influence concentrations of ammonium and amino sugar-nitrogen in soils . Jing-Shu Wang, Saeed A. Khan, and Jeffrey O. Dawson Department of Natural Resources and Environmental Sciences, University of Illinois, Urbana, IL 61801, USA. Introduction .

E N D
Nitrogen fixing trees influence concentrations of ammonium and amino sugar-nitrogen in soils Jing-Shu Wang, Saeed A. Khan, and Jeffrey O. Dawson Department of Natural Resources and Environmental Sciences, University of Illinois, Urbana, IL 61801, USA
Introduction • The recently-developed Illinois Soil Nitrogen Test (ISNT) measures the combined concentration of ammonium- and amino sugar-N in soils, providing a novel, alternative approach to N fertility assessment. The nonresponse level to N fertilization for corn is 235 (mg · kg-1 or 635 lbs per acre) amino sugar plusammonium N.
Introduction • A positive correlation between soil amino sugar-N plus NH4-N values and check-plot yield was described by Mulvaney et al. at the U. of Illinois. This method to determine soil N availability is sensitive and provides a simple estimation of soil capacity to supply plant-available N.
Introduction • Amino sugar-N in soils originates from microbial activity rather than from higher plants. Therefore, the concentration of amino sugar-N in soils reflects the level of mineralizable N and soil capacity to supply N to promote plant growth.
Rationale Amino sugar-N is a key soil organic fraction associated with soil N fertility. It is different from leachable NO3- in that it is more stable. It should provide a straightforward and more accurate estimate of soil N fertility than other methods currently available (total N, lab incubations for mineralization, buried bag, resin exchange).
Hypothesis Amino sugar-N will increase in concentration in soils under nitrogen-fixing trees.
Objectives • 1) to determine how different densities, sizes and species of nitrogen-fixing trees in different soil types affect soil concentrations of amino sugar-N (plus ammonium). • 2) to describe amino sugar-N distribution with respect to soil depths in plots with and without N2-fixing trees.
Study Sites in East-Central Illinois • The University of Illinois Arboretum (N. Lat. 40o). • The Douglas-Hart Nature Center (DHNC), a 50-year-old interplanting of either 2 native trees per 1 N2-fixing A. glutinosa or Robinia pseudoacacia L. tree or no N2-fixing nurse trees at all (spacing 10 × 10 feet). • Kickapoo State Park in Vermilion County, IL on 45-year-old mine spoils.
Illinois Soil Nitrogen Test • The samples were analyzed using the ISNT technique described by Khan et al. (Soil Sci. Soc. Am. J. 65:1751-1760. 2001). • H3BO3-indicator solution was suspended from the lid of a Mason jar. Sealed jars were heated for 5 hours in 10 ml of 2 M NaOH at precisely 48 oC. After 5 hours of ammonia diffusion, the H3BO3-indicator solution was titrated with 0.01 M H2SO4 to determine quantity of ammonium from amino sugar and ammonium N in the soil samples.
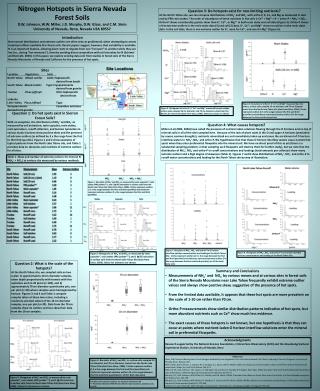
Soil depth Number of samples Mean amino sugar [ N ] Near A. glutinosa trees Depth 0-10 cm 28 424.3a1 Depth 10-20 cm 28 307.0b Depth 20-30 cm 28 330.7b Near T. americana tree 0-10 cm 7 456.7a1 10-20 cm 7 368.1b 20-30 cm 7 362.8b Individual mean differences in amino sugar nitrogen concentration (mg · kg-1) of soil from different depths associated with actinorhizal A. glutinosa trees and a T. americana tree at the University Arboretum. 1 Means with the same letter for a tree species are not significantly different (LSD, α= 0.05).
Canopy position Number of samples Mean amino sugar [ N ] A. glutinosa trees Under the canopy 18 381.1a1 Away from the canopy 25 336.5b T. americana tree Under the canopy 4 375.2a1 Away from the canopy 3 391.1a Individual mean differences in amino sugar nitrogen concentration (mg · kg-1) in the top 30 cm of soil associated with actinorhizal A. glutinosa trees and a T. americana tree at the University Arboretum. 1 Means with the same letter for a tree species are not significantly different (LSD, α= 0.05).
Chemical analysis of the surficial 30 cm of soil at the Arboretum. CEC= cation exchange capacity. Values are means with standard deviation within parenthesis. 1 Illinois Soil Nitrogen Test (Khan et al., 2001). 2 Total nitrogen (Kirsten and Hesselius,1983). 3 Cation exchange capacity. 4 Base saturation percentage of cation exchange sites. 5 Means with the same letter within a column for a given location are not significantly different (LSD, α= 0.05).
Ammonium and amino sugar-N concentration • For DHNC, significant differences occurred for depths, but not for past alder or black locust influence (nitrogen fixing nurse trees mostly dead after 50+ years). • There is more biomass in the interplanted stands at DHNC, which could constitute a major N pool for the site and explain the lack of significant differences in soil amino sugar-N.
Soil depth Number of samples Mean amino sugar [ N ] 0-10 cm 26 253.8a1 10-20 cm 26 47.7b 20-30 cm 24 35.5b Individual mean differences in amino sugar nitrogen concentration (mg · kg-1) of different soil depths at Kickapoo State Park. 1 Means with the same letter are not significantly different (LSD, α= 0.05).
Vegetative cover Number of samples Mean amino sugar [ N ] E. umbellata 4 103.6a1 A. glutinosa 18 98.4a Grass or S. interior 3 54.3b Individual mean differences in amino sugar nitrogen concentration (mg · kg-1) in the top 30 cm of soil for different vegetation at Kickapoo State Park. 1 Means with the same letter are not significantly different (LSD, α= 0.05).
Chemical analysis of the surficial 30 cm of soil on mine spoils. CEC= cation exchange capacity. Values are means with standard deviation within parenthesis. 1 Illinois Soil Nitrogen Test (Khan et al., 2001). 2 Total nitrogen (Kirsten and Hesselius,1983). 3 Cation exchange capacity. 4 Base saturation percentage of cation exchange sites. 5 Means with the same letter within a column for a given location are not significantly different (LSD, α= 0.05).
Soil Depth Strata • Amino sugar-N concentrations were always highest in the top 10 cm of soil consistent with the input of organic N from annual litter fall and surficial root dieback, but the mount of increase over control amount with respect to lower strata varied… minespoil w N fixers>mollisols w N-fixers>
Arboretum Findings • The significant 13 % increase in soil amino sugar N under the A. glutinosa canopy occurred, even though soil amino sugar levels indicate high N fertility. High N fertility levels can inhibit symbiotic nitrogen fixation by plants through energy conserving feedback mechanisms.
Additional Arboretum Findings • At the University Arboretum under A. glutinosa leaf canopies, there were significantly higher amino sugar-N concentrations, lower pH values and greater proton saturation of CEC exchange sites than beyond A. glutinosa canopies in the 0-30 cm soil layer. Increased ammonium nitrogen from mineralization of litter and sloughed roots of A. glutinosa tissue enriched with fixed N is oxidized to nitrate via microbial nitrification, which can decrease soil pH and thereby increase cation leaching. Total N and amino sugar-N in soils were not correlated at this site.
Mine Spoil Findings • On mine spoils, both E. umbellata and A. glutinosa had significantly higher amino sugar-N concentrations than the control plot. The E. umbellata plot had the highest amino sugar-N, followed by the A. glutinosa plot and, lastly, the control plot.
Mine Spoil Findings • At Kickapoo State Park, the only significant correlation was negative (r= -0.681) for the relationship between amino sugar-N concentration and total N. Higher amino sugar-N concentration may reflect abundant and easily mineralizable N of the actinorhizal plant litter and sloughed roots.
Mine Spoil Findings • There was higher phosphorus concentration beneath A. glutinosa at Kickapoo State Park similar to findings of Giardina et al. (1995)
Conclusions • ISNT is sensitive to soil nitrogen fertility contributions by nitrogen-fixing trees, The test itself is simple, precise and employs commonly-available materials. The test results, when calibrated with corresponding levels of productivity, should be able to predict soil N fertility and the potential benefits of planting N-fixing trees on a particular soil type.
THANK YOU Any questions?