Download
1 / 1
10 likes | 178 Views
Nitrogen Hotspots in Sierra Nevada Forest Soils D.W. Johnson, W.W. Miller, J.D. Murphy, D.W. Glass, and C.M. Stein University of Nevada, Reno, Nevada USA 89557. Question 3: Do hotspots exist for non-limiting nutrients?

E N D
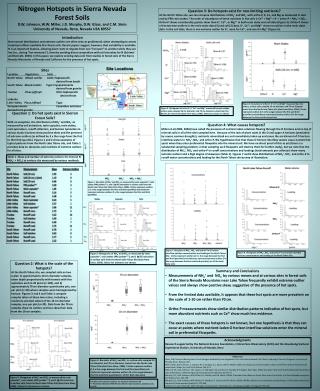
Nitrogen Hotspots in Sierra Nevada Forest Soils D.W. Johnson, W.W. Miller, J.D. Murphy, D.W. Glass, and C.M. Stein University of Nevada, Reno, Nevada USA 89557 Question 3: Do hotspots exist for non-limiting nutrients? At the North Tahoe site, we can compare distributions of NH4+ and NO3- with ortho-P, K, Ca, and Mg as measured in soils and by PRS resin stakes. The order of abundance of these nutrients in the soils is Ca2+ > Mg2+ > K+ > ortho-P > NH4+ + NO3-. Ortho-P shows considerably greater skew than K+, Ca2+, or Mg2+ in both resin stake and soil data (Figure 5). Ortho-P shows a few extreme outliers in the resin stake data (3) and soil (2) data. K+, Ca2+, and Mg2+ show no outliers in the resin stake data. In the soil data, there is one extreme outlier for K+, none for Ca2+, and one for Mg2+ (Figure 6). Introduction Non-normal distributions and extreme outliers are often seen as problematic when attempting to assess treatment effects available N in forest soils. Recent papers suggest, however, that variability in available N is an important feature, allowing plant roots to migrate from one “hot spot” to another while they are hot (i.e., during “hot moments”), thereby avoiding direct competition with soil microbes for N (Schimel and Bennett, 2004). In this paper, we explore existing data sets from studies in forest soils of the Sierra Nevada Mountains of Nevada and California for the presence of hot spots. Sites Location Vegetation Soils North Tahoe Mixed conifer Andic Haploxeralfs derived from basalt South Tahoe Mixed conifer Typic Cryopsamments derived from granite Truckee Pinus jeffreyii Ultic Haploxeralfs derived from andesite Little Valley Pinus jeffreyii Typic Xeropsamments Ceanothus velutinus derived from granite Figure 6. Box plots of ortho-P, K+ Ca2+ and Mg2+ measured by resin stakes, surface soils sampled 10 cm diameter and 70 cm diameter scales from the North Lake Tahoe Site (data from Glass, 2006). Circles represent outliers (1.5 x the range between the first and third quartiles) and starbursts represent extreme outliers (3 x the range between the first and third quartiles) Question 1: Do hot spots exist in Sierran Forest Soils? With no exception, the distribution of NH4+ and NO3- as measured by soil extraction, resin capsules, resin stakes, resin lysimeters, runoff collectors, and tension lysimeters in various study locations show positive skew and the presence of extreme outliers (as defined by 3 x the range from the first to the third quartile). Figures 1 and 2 show examples of typical patterns from the North Lake Tahoe site, and Table 1 provides data on skewness and numbers of extreme outliers for all sites. Question 4: What causes hotspots? Miller et al (2005, 2006) have noted the presence of nutrient-laden solutions flowing through the O horizons and on top of mineral soils in all of the sites sampled here. Because of the lack of plant roots in the O and upper A horizons (precluded by severe summer droughts), nutrients mineralized are not immediately taken up and cause the enrichment of O horizon interflow waters in NH4+, NO3- and ortho-P. We hypothesize that that these O horizon interflow waters cause nutrient hot spots when they enter preferential flowpaths into the mineral soil. We have no direct proof of this as yet (there is a substantial sampling problem, in that sampling such flowpaths will destroy them for further study), but we note that the distribution of NH4+, NO3- and ortho-P in runoff concentrations and loadings (total amounts per collector) show many extreme outliers and a high degree of skewness (Table 1). Figures 7 and 8 show distributions of NH4+, NO3- and ortho-P in runoff water concentrations and loading for the North Tahoe site by way of illustration. Figure 5. Histograms of ortho-P, K+ Ca2+ and Mg2+ measured by resin stakes, surface soils sampled 10 cm diameter and 70 cm diameter scales from the North Lake Tahoe Site (data from Glass, 2006). Skewness values are shown Table 1. Skew and number of extreme outliers for mineral N (NH4+ + NO3-) at various site measured by various methods. Figure 7. Box plots of NH4+, NO3- and ortho-P in O horizon interflow solution concentrations and loading at the North Tahoe Site. Circles represent outliers (1.5 x the range between the first and third quartiles) and starbursts represent extreme outliers (3 x the range between the first and third quartiles) (n= 20 for both data sets) Figure 8. Histograms of NH4+, NO3- and ortho-P in O horizon interflow solution concentrations and loading at the North Tahoe Site. Figure 2 Histograms of NH4+ and NO3- as measured by resin capsules*, resin stakes (PRS probes**), and 1 M KCl extraction in surface soils from the North Lake Tahoe Site (data from Glass, 2006). Values for skewness are shown. Question 2: What is the scale of the hotspots? At the North Tahoe site, we sampled soils on two scales: 1) approximately 10 cm diameter samples, taken depth proportionally with trowels with five replicates each in 20 plots (n=100), and 2) approximately 70 cm diameter quantitative pits, one per plot (n=20) where samples were homogenized by horizon. Figures 3 and 4 and Table 1 compare samples taken at these two scales, including a randomly-selected subset of the 10 cm diameter samples, one per plot (n=20). Data from the 70 cm samples show no outliers and less skew than data from the 10 cm samples. • Summary and Conclusions • Measurements of NH4+ and NO3- by various means and at various sites in forest soils of the Sierra Nevada Mountains near Lake Tahoe frequently exhibit extreme outlier values and always show positive skew, suggestive of the presence of hot spots. • From the limited data available, it appears that these hot spots are more prevalent on the scale of 1-10 cm rather than 70 cm. • Ortho-P measurements show similar distribution patterns indicative of hot spots, but more abundant nutrients such as Ca2+ show much less evidence. • The exact causes of these hotspots is not known, but one hypothesis is that they can occur at points where nutrient-laden O horizon interflow solutions enter the mineral soil in preferential flowpaths. Acknowledgments Research supported by the National Science Foundation, Critical Zone Observatory (CZO) and the Nevada Agricultural Experiment Station, University of Nevada, Reno References Glass, D.W. Factors Affecting Short Term Nitrogen Availability from Vegetation Fire in the Sierra Nevada. MS Thesis, Hydrologic Sciences Program, University of Nevada, Reno, Nevada USA. Miller, W.W., D.W. Johnson, C. Denton, P.S.J. Verburg, G.L. Dana, and R.F. Walker. 2005. Inconspicuous nutrient laden surface runoff from mature forest Sierran watersheds. Water, Air, and Soil Pollution 163:3-17. Miller, W. W., D.W. Johnson, T.M. Loupe, J.S. Sedinger, E.M. Carroll, J.D. Murphy, R.F. Walker, D.W. Glass. 2006. Nutrients Flow from Runoff at Burned Forest Site in Lake Tahoe Basin. California Agriculture/University of California, 60: 65-71. Murphy, J.D., D.W. Johnson, W.W. Miller, R.F. Walker, and R.R. Blank. 2006a. Prescribed fire effects on forest floor and soil nutrients in a Sierra Nevada ecosystem. Soil Science 171: 181-199. Murphy, J.D., D.W. Johnson, W.W. Miller, R.F. Walker, E.F. Carrol, and R.R. Blank. 2006b. Wildfire effects on soil nutrients and leaching in a Tahoe Basin watershed. Journal of Environmental Quality 35: 479-489. Schimel, J.P., and J. Bennett. 2004. Nitrogen mineralization: Challenges of a changing paradigm. Ecology 85: 591-602. Figure 4. Box plots of NH4+ and NO3- in surface soils sampled 10 cm diameter and 70 cm diameter scales from the North Lake Tahoe Site (data from Glass, 2006). Circles represent outliers (1.5 x the range between the first and third quartiles) and starbursts represent extreme outliers (3 x the range between the first and third quartiles) (n= 20 for both data sets) Figure 3. Histograms of NH4+ and NO3- as measured by resin capsules*, resin stakes (PRS probes**), and 1 M KCl extraction in surface soils from the North Lake Tahoe Site (data from Glass, 2006). Values for skewness are shown. *Unibest resin capsules, Unibest, Inc, Bozeman, Montana USA ** Plant Root Simulator (PRS) Probes, Western Ag Innovations, Saskatoon, SK, Canada