Download
1 / 10
100 likes | 221 Views
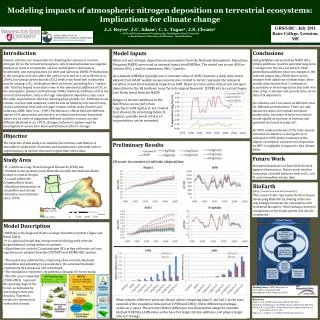
Influence of greater Nitrogen Deposition in Missoula, MT. Anne Trainor Exercise 3 October 2, 2007. Introduction. Substantial increase of nitrogen deposition since the industrial boom large impacts on forested ecosystems. Objective:

E N D
Influence of greater Nitrogen Deposition in Missoula, MT Anne Trainor Exercise 3 October 2, 2007
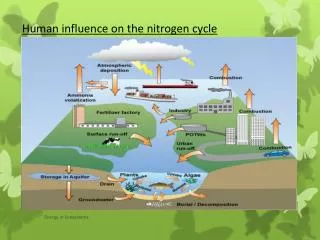
Introduction • Substantial increase of nitrogen deposition since the industrial boom • large impacts on forested ecosystems. • Objective: • Examine how a significant increase in nitrogen could influence annual and seasonal nutrient cycling dynamics within an evergreen forest.
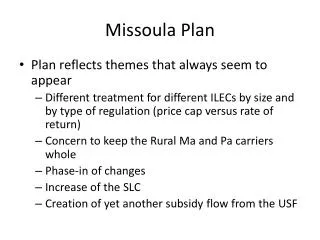
Study System • Missoula, MT • Meteorological Data: 1950-1993 • 1 m Loamy Soil • 30% sandy, 50% silt, 20% clay • Evergreen Needleleaf system • Used all defaults
Modeling • Biome-BGC (version 4.1.2) • Carbon levels constant at default value (294.842 ppm) • Consisted of 3 runs for 88 years • A) Spin up: Default pre-industrial nitrogen level (0.0001 kgm2yr1) • B) Typical Nitrogen: Based off previous Spinup ran simulation with default pre-industrial nitrogen level (0.0001 kgm2yr1) • C) Increased Nitrogen: Based off original Spinup ran simulation with Nitrogen increased to 0.005 kgm2yr1
Methods Selected a consecutive dry and wet year to compare extremes 1980 and 1981 1973 and 1974