Download
1 / 10
100 likes | 232 Views
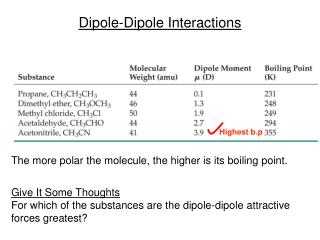
Procedure of the AC Dipole Measurements. Ryoichi Miyamoto Last Update 10/21/2008. This note explains how to make measurements with the Tevatron Vertical AC Dipole System from the Main Control Room. 1. Magnet Setup at E17 Service Building. To be safe, go to the E17 service

E N D
Procedure of the AC Dipole Measurements Ryoichi Miyamoto Last Update 10/21/2008 This note explains how to make measurements with the Tevatron Vertical AC Dipole System from the Main Control Room.
1. Magnet Setup at E17 Service Building To be safe, go to the E17 service building and turn off the DC power supply used in the pinger mode.
2. Preparation of Devices • Agilent 33220A (Modulator) • Press Graph. • Press Utility and choose Output Setup. Select High Z for the Load. • Press Arb, and choose Selected Wform and Stored Wforms. Select a waveform whose name starts with ACD based on the ramp time (The standard is ACD_2321 which means 2k turns of ramp up and down and 3k turns of flattop.). Press Done. • Change Period, HiLevel, and LoLevel to 168 ms, 5 V, and 0 V for each. • Press Burst and make sure the number of cycles is 1. Press Trigger (in Softkeys) and change Source to Ext. Make sure the Slope is set to Positive. Press Done. • The output goes to AM(EXT) of SF DS345 and scope. • Press Output. • SF DS345 (Sine Wave Carrier) • To change frequency and amplitude, press FREQ or AMPL and input the number. • Notice the actual voltage is twice of the number on the display (because the input of the amplifier has high impedance). • I-T8000 (Amplifier) • Go to CH1 Sensitivity by pressing Menu/Exit once and Next twice. Make sure RMS Volts is 3.54 and dB Gain is 37.3. Press Menu/Exit. • It may be safe to apply attenuation when the dipole is not used. • Scope • Make sure the input impedances for all channels are 1 MΩ.
3. List of Useful AcNet Parameters The plot shows a list of useful AcNet parameters to monitor, during the AC dipole study. The flying wires can be used from T46.
4. AC Dipole Setup in C9-F0 LAM-11 Switch the magnet to the AC dipole mode (negative polarity, displayed as “A”). Change the timing of T:VPNGAD to 1.191 sec. The difference between C:EVTDAX and T:VPNGAD should be 0.01−0.02 sec or 500−1000 rev. Arm T:VPNGAD to the 4C event. Enable T:VPNGAD. After a study, set the parameters to the original values. • Set the frequency (T:DS345F) and input voltage (T:DS345A) of the waveform • generator. Turn down the voltage to 0.01 V after every excitations. • See the tables in pages 9 & 10 for the relation among the frequency,driving tune, • input voltage, andoscillation amplitude. • The voltage and frequency are adjusted by 0.01 V and 0.01 Hz. Be careful that the • frequency is in “Hz”, not in “kHz”. • No change for the parameters of the AC dipole’s ramp: T:HP332A and T:HP332F.
5. Data Acquisition with T42 Reboot T42 in each measurement. Choose the BPM’s to be used. Note that acquiring all the BPM data takes about 4.5 min. Just for a testing, use a small number of BPM’s. Data acquisition is done from “Data” page. For “Trigger Selection”, choose “New Triggered Data Only, No Kick”. Make sure that the kicking is disabled and plotting is enabled. “Get Data” starts the acquisition.
6. Data Check with T42 After the data acquisition, T42 automatically plots TBT data. We can change the BPM. We can plot the TBT or tune. We can change the axesranges. Select “Plot” for re-plotting. An example
7. Data Saving with T42 BPM’s data can be saved from the “Write” page. I usually disable the “header” and “status” information. My Mathematica codes read horizontal and vertical data separately. The unit should be “millimeters”. Intensity may not be necessary. “Write” uploads text files into a directory under http://www-bd.fnal.gov/userb/tevatron/tbt/ The name of the directory is yymmdd_time, 080930_1411 in this case.
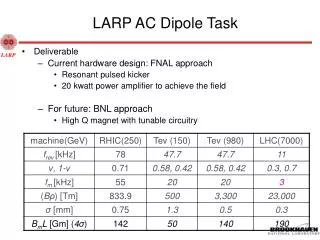
8. Table for 150 GeV Note: the revolution frequency at 150 GeV is 47.7122012579 kHz.
9. Table for 980 GeV Note: the revolution frequency at 980 GeV is 47.7131060198 kHz.